Next year, nearly 500 local elections for Senate and House seats are taking place across the United States. As part of our mission to help journalists report on the stories that matter, we worked with ProPublica to build the Election Databot: a tool that provides data about all of those elections, from campaign spending to Google Search Trends for candidates.
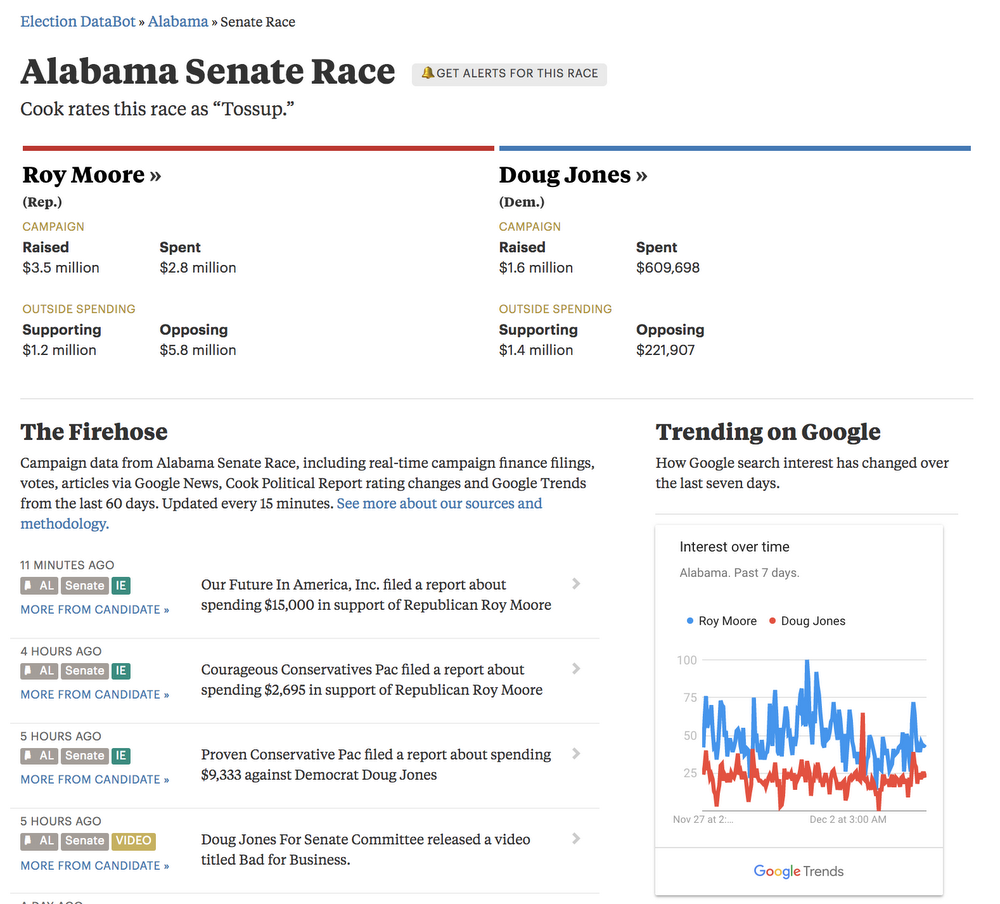
We launched the Databot for the 2016 general election, but this new version shows complete information for all the House and Senate races through November 8, 2018. It also includes this year’s special election on December 12 between Republican Roy Moore and Democrat Doug Jones, who are vying for one of Alabama’s Senate seats.
The new version of the Databot includes key data for national and local reporters writing about the hundreds of local races taking place across America, including:
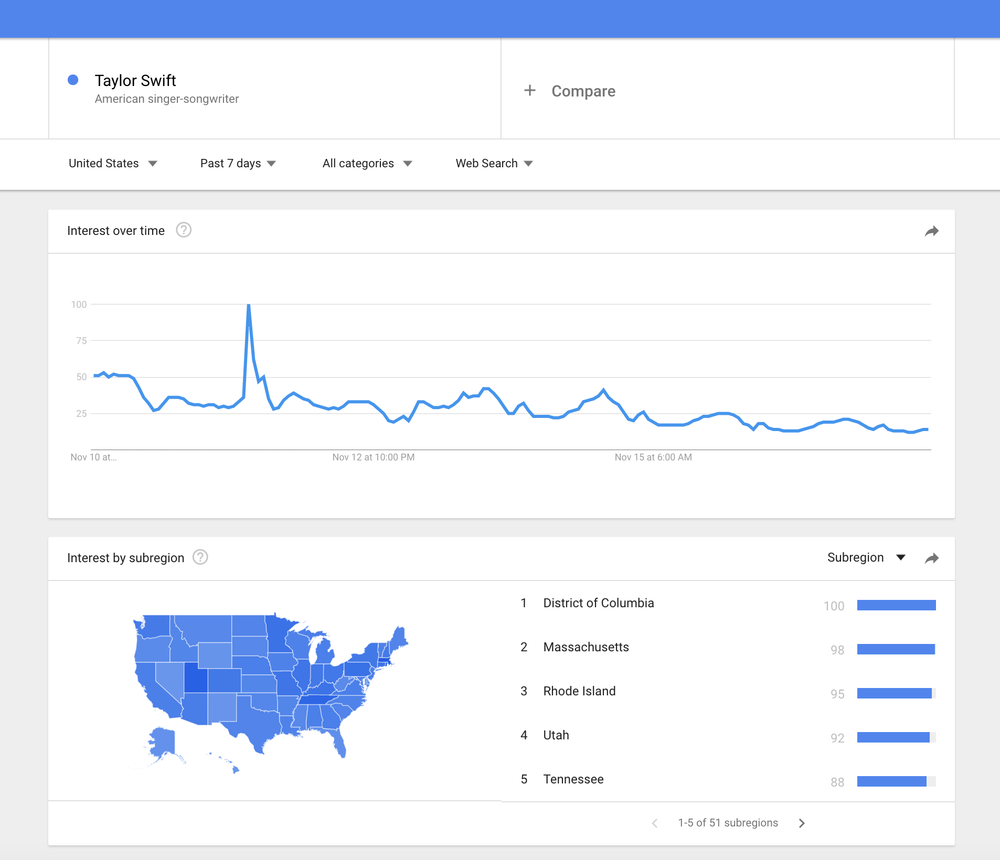
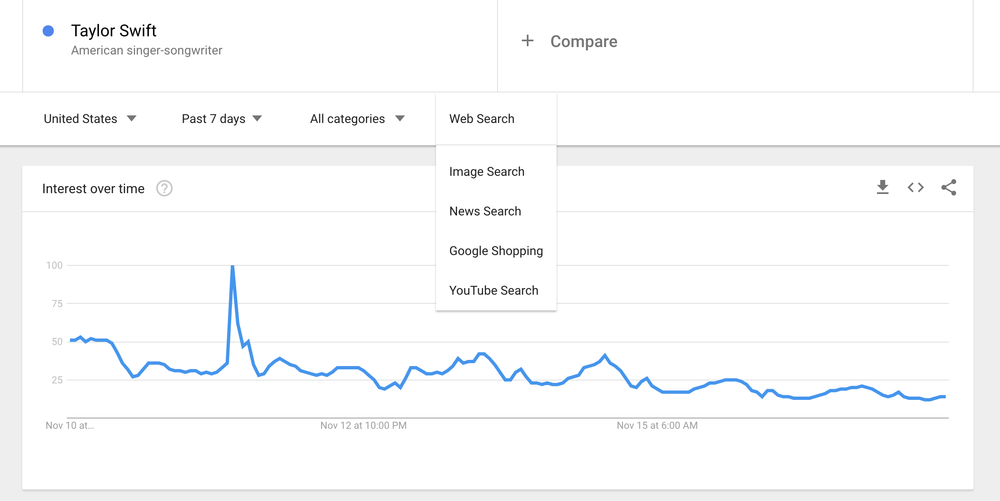
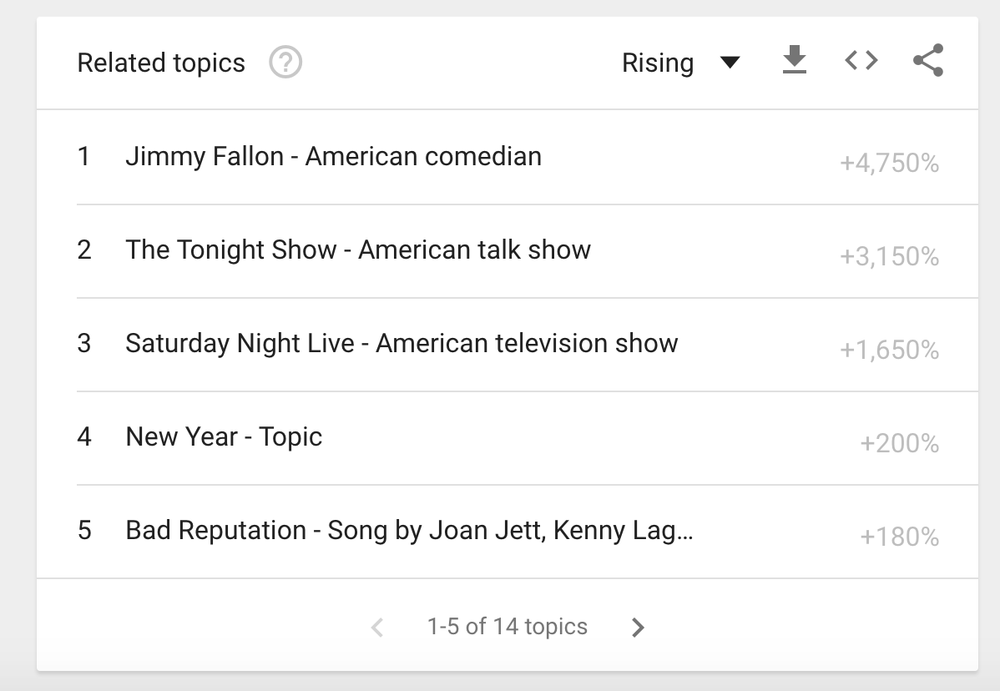
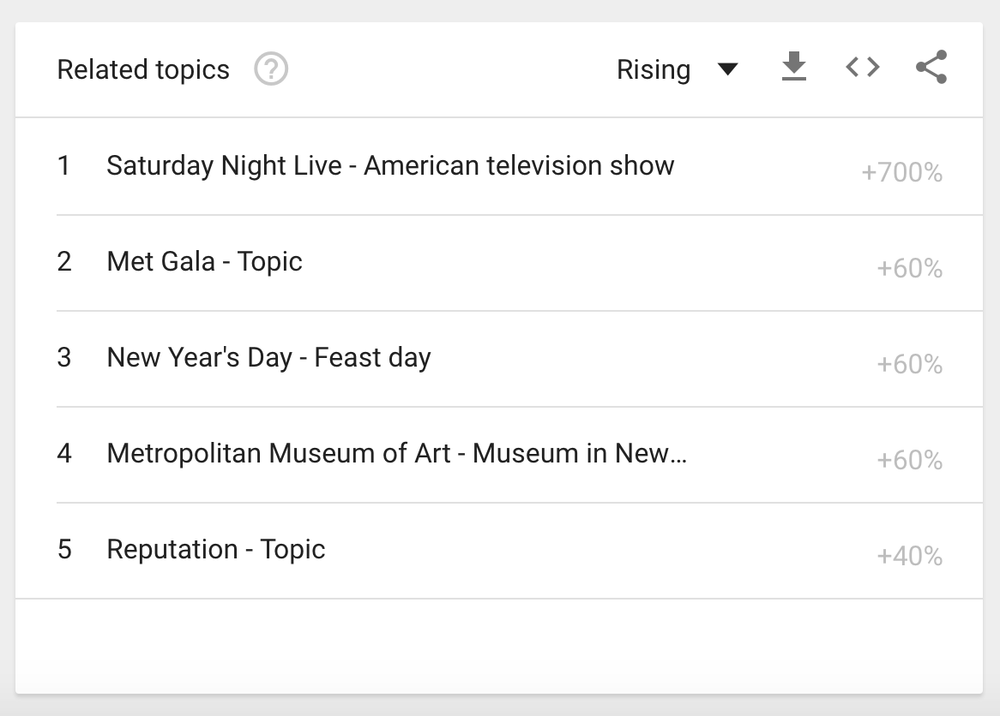
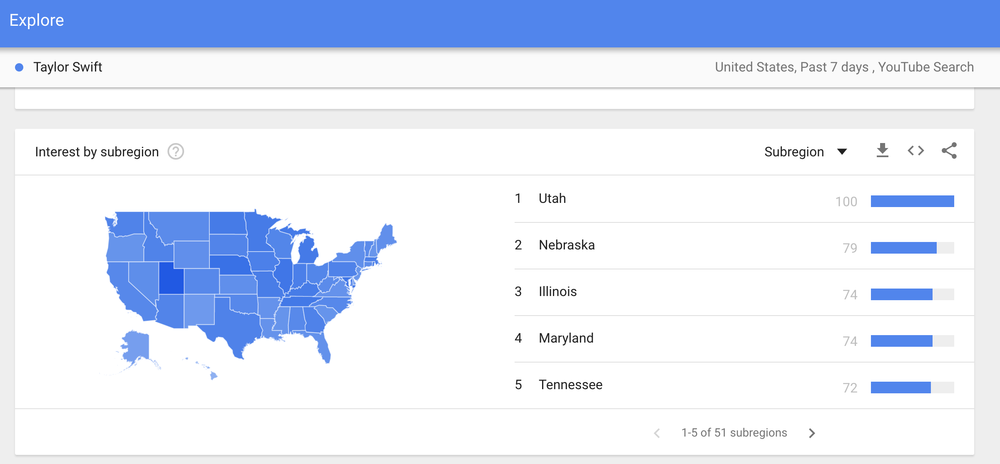
- Google Search Trends for each candidate and incumbent with real-time search data
- YouTube videos from candidates and incumbents
- Candidate spending data from the FEC
- Voting records and Congressional data
- Articles from Google News, including local news sources about each candidate
- Press statements from each incumbent candidate
- Cook report race ratings for each election
- Deleted Tweets from Politwoops
You can explore either national or local data, and can set up notifications for a particular race. 2018 will be a big year for politics, and the Databot can help journalists report on election stories in new and exciting ways.