Editor’s note: Today’s guest blogger is Robert James Reese, executive producer for Runner's World Online. Read how Runner’s World’s 40 Million Steps website used Google Maps APIs to build a virtual tour of an around-the-world run.
The journey of one runner's trek around the globe is an amazing feat, and at Runner’s World we wanted people to share in the experience. To do this, we created the 40 Million Steps website, which allows people to relive Tom Denniss’ record-breaking, 622-day, world-spanning run.
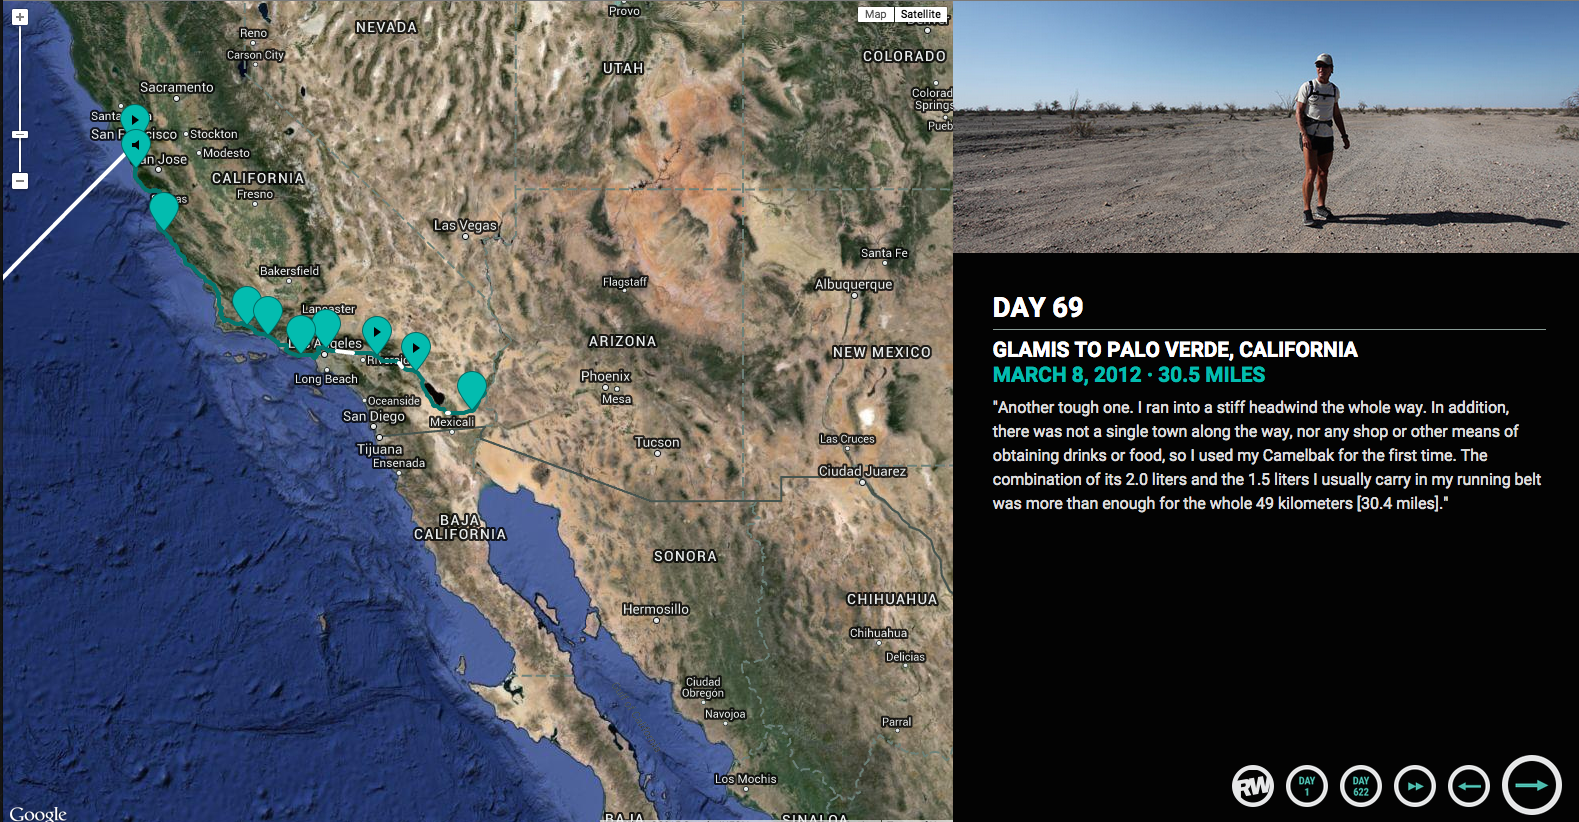
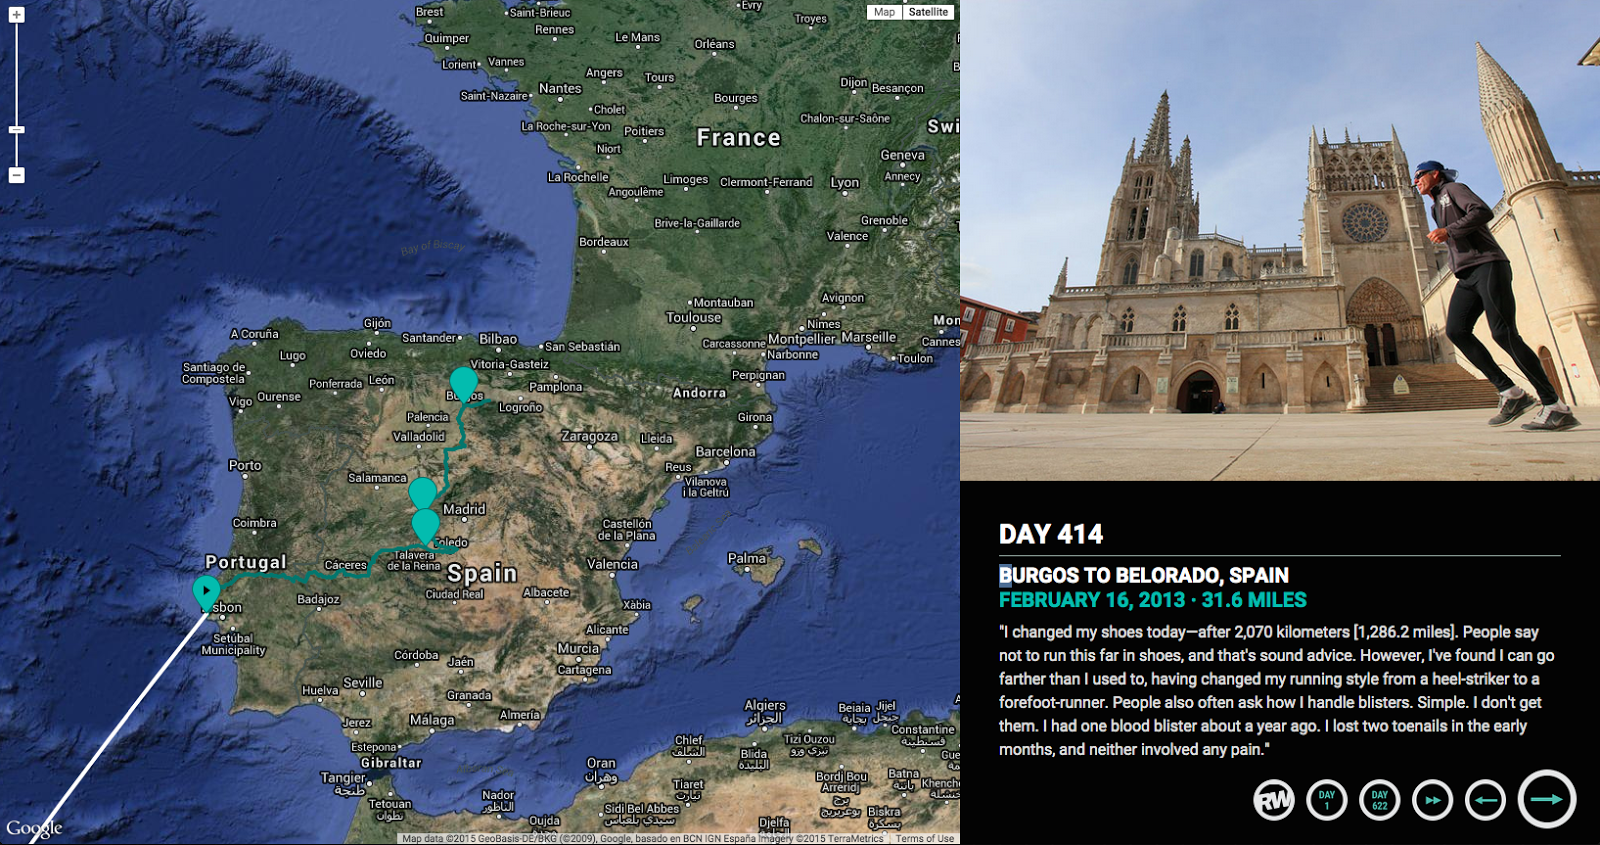
The site uses Google Maps APIs to allow people to relive Denniss’ 16,300-mile run. Using Satellite View, users can click on the map to see the thousands of photos and nearly 400 videos captured during Denniss’ journey, making it feel as if they were there.
Our online launch coincided with a feature we ran in our April 2015 print issue, so we wanted the online version to have some of the same look and feel to create a cohesive connection between print and online. The styling for the map itself is all specified through the styles property of the MapOptions object in our JavaScript.
 |
| Users view Day 1 of the run and are able to click through his progress. |
We used the Geocoding API and the Elevation API as editorial tools. The Geocoding API helped us to fact-check location names, and we used the Elevation API to find out and highlight interesting facts about the run, such as its lowest and highest points.
The Javascript API was key in building the site. We faced a real challenge because of the amount of data we had from the run, on which Denniss wore a GPS-enabled watch to record his locations. Typically, when creating a polyline with the Google Maps API, we would have just included a "new google.maps.LatLng" on a separate line for each point, as shown in the documentation on Google’s developer site. However, since we were dealing with over 3 million GPS data points, it was too many for the browser to handle, so we simplified the polyline before sending the points to the browser by sampling every 20th data point.
We set out to build the site to impress our audience and give them something really cool that they hadn’t seen before. There’s arguably no better way to experience the joy, pain, exhaustion and exhilaration that Denniss felt during his run around the world—and Google Maps APIs were key to bringing his adventure to life.