The following is a guest post by Benjamin Mangold, Director of Digital & Analytics at Loves Data, a Google Analytics Certified Partner.
Creating custom Google Analytics Dashboards is a great way to monitor performance and get quick insights into the success of key aspects of your websites and mobile apps. You can create dashboards to meet your particular needs, from understanding marketing campaign performances, to content engagement levels, and even trends relating to goal conversions and e-commerce transactions.
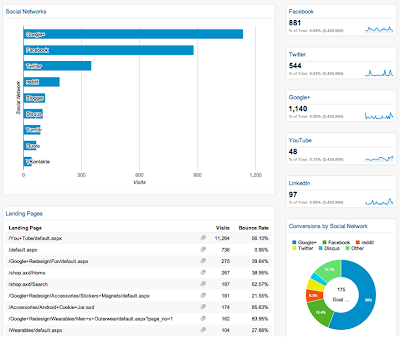
Sample custom dashboard (click for full-size image)

The dashboards you create will depend on who is going to use them. You will want the dashboard used by your marketing manager to be different to the dashboard that is seen by your technical team - and different again for your CEO. You should always tie dashboards to the types of questions the particular person or stakeholder is going to ask. Basing your dashboards on particular roles or job functions within your organisation is a good place to start thinking about the type of dashboards you will want to design.
Dashboard Widgets
Each dashboard is made up of widgets which can be pieces of information or data from your Google Analytics reports. There are a number of different widgets and the ones you add to your dashboard will depend on the type of trends and insights you want to provide.
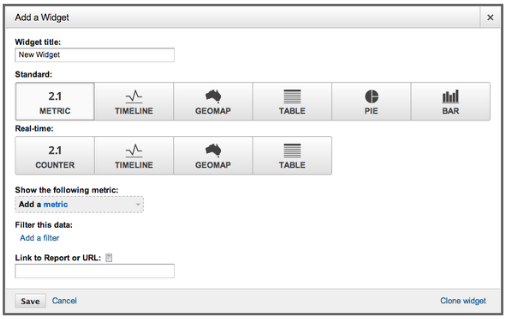
Metric widgets present a single piece of data on your dashboard along with a small sparkline.
Timeline widgets give a detailed sparkline showing trends by day. This widget allows you to show a single metric or compare two metrics.
Geomap widgets allows you to display a map within your dashboard. You can show the location of your visitors and even compare conversion rates or engagement by geographic location.
Table widgets display a table that combines information (a dimension) with up to two metrics.
Pie widgets present a pie or doughnut chart and are useful for visual comparisons.
Bar widgets are also useful for presenting comparisons. This widget allows you to pivot by an additional dimension and switch between horizontal and vertical layout.
In most cases you will want to use the ‘standard’ widgets. These present data that has been processed into the standard reports. You can also include ‘real-time’ widgets, but it is important to know that these will not be included if you are exporting or scheduling the dashboard.
Widget Filters
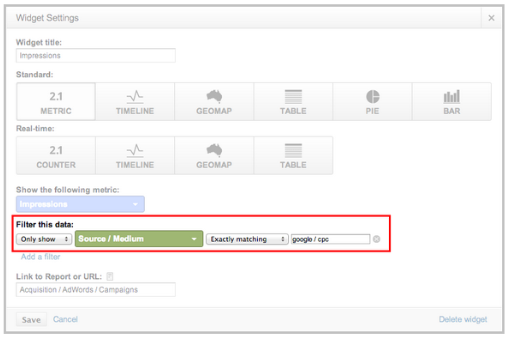
Filters can be applied to widgets within your dashboard, allowing you to further define what is presented in your dashboard. For example, if you want to include a metric widget to show the total number of visits from your Google AdWords campaigns, you could then add the following filter which will only include visits where the source is ‘google’ and the medium is ‘cpc’.
Sharing Dashboards
Once you have created your custom dashboards you can keep these private, share the dashboard with everybody who has access to the reporting view or even share them with the wider Google Analytics community. The Google Analytics Solutions Gallery is a crowdsourced collection of customizations and includes a number of great dashboards that you can add to your account.
Have a great dashboard? Want to win prizes? Loves Data, a Google Analytics Certified Partner are running a competition for the best Google Analytics Dashboard. Judges include Google’s own Justin Cutroni, Daniel Waisberg and Adam Singer. The competition closes on December 31, 2013 and winners will be announced in late January 2014. |
Posted by Benjamin Mangold, Google Analytics Certified Partner

