Today, we're happy to announce that we're bringing Google Cloud Logging and Google Cloud Monitoring closer together to help you gain better insights into your logs. As part of this, we have just launched the following Beta features:
- Logs-based Metrics let you create a metric from a logs filter expression that you build in Cloud Logging. You can use these metrics to build dashboards and create alerting policies in Cloud Monitoring.
- Advanced Logs Filters provide a rich filter syntax to select log entries and create logs-based metrics.
- Charts to Logs allow you to quickly go from charts to the corresponding logs, where you can investigate and resolve issues.
Logs-based Metrics
You often want to be alerted when particular events occur, or occur at an elevated rate, or exceed a specified count. Existing monitoring tools do not allow you to easily connect your logs to your monitoring console. With this launch, Google Cloud Monitoring adds to its current out-of-the-box metrics the ability to use granular metrics from your logs.
Let’s look at an example. You’re running a particular Google App Engine module, "redis," and version, "walkshare3." You want to be alerted when that server is not able to fulfill HTTP requests due to a particular error. Your first step is to create a metric that counts the log entries from your app that show a 5XX status and contain the string "self.handle_exception." In Cloud Logging, you build a logs filter that shows just those log entries.
Select the metric icon


You are not limited to looking at error logs. For example, you can create a metric that counts the number of requests for a particular URL:

Select the Metrics tab in Cloud Logging and view the metrics you created. Edit them, or go directly to Cloud Monitoring and use the metrics for charts and alerts. In addition to your user-defined logs metrics, you can use three built-in system metrics that count important logging events for each log:

To create an alert, select Create alert from metric. This takes you directly to the Cloud Monitoring dialog for creating alerting policies, where your metric is already inserted into the condition box (see below). In this example, you decide to set an alert if the number of 5XX errors your metric is tracking increases by more than 30% in a 15-minute period. Finish creating the alerting policy, choose a notification method, and you're done.

To create a chart that displays your logs-based metrics, use the Cloud Monitoring chart-creation tools. You will see your logs-based metrics listed alongside all the other metrics:

Our early access users are already getting value from the capability. Here is what one customer had to say:
“We have been very pleased with the Logs-based Metrics solution. We were sitting on a lot of valuable log data but had been missing insights and there was no good way to gather metrics from them. We experimented with some open source solutions, but it's a lot of work to manage it for the amount of logs we produce. We like that Cloud Logging is a fully managed service with great performance, scalability and feature set. We can now add new metrics on a running production system which has helped us diagnose issues and monitor new signals." - Arjen van der Ende, Engineer at Q42
Advanced Logs Filters
The power of logs-based metrics is largely due to the new advanced logs filters in Cloud Logging. With these filters you can create complex Boolean tests and even select log entries from multiple log sources. The following advanced filter shows your tests for 5XX status and handler exception shown above:

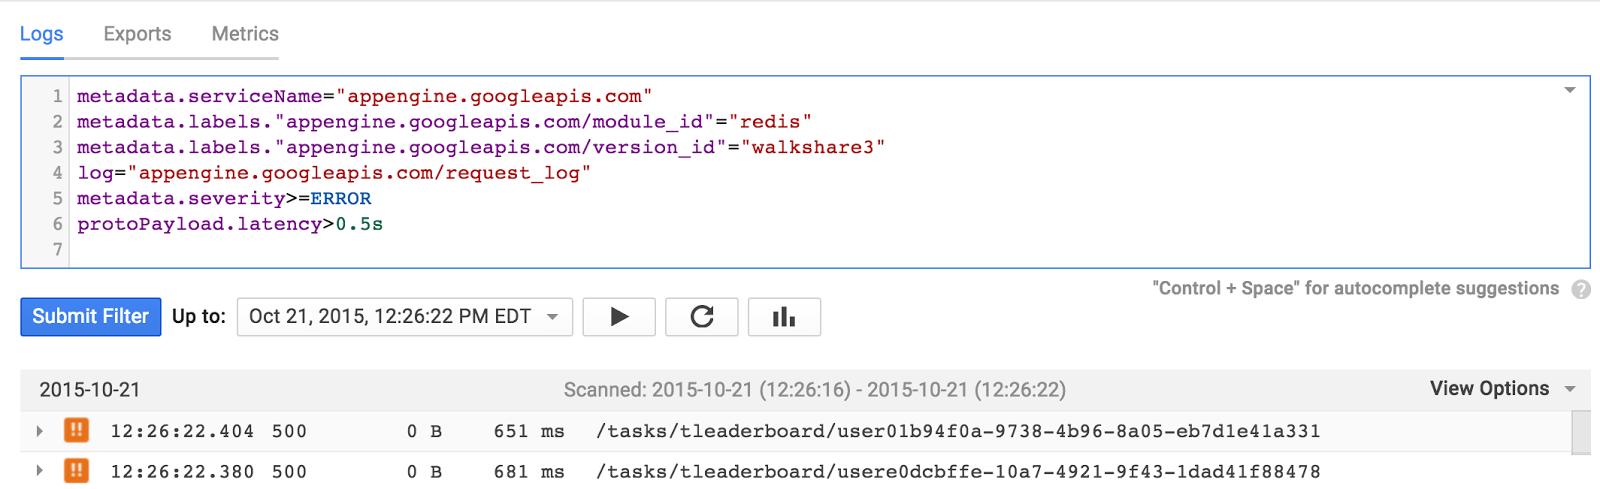
The following example shows how to narrow down requests that have high latency. The filter shows requests with latency higher than 500ms:
Charts to Logs
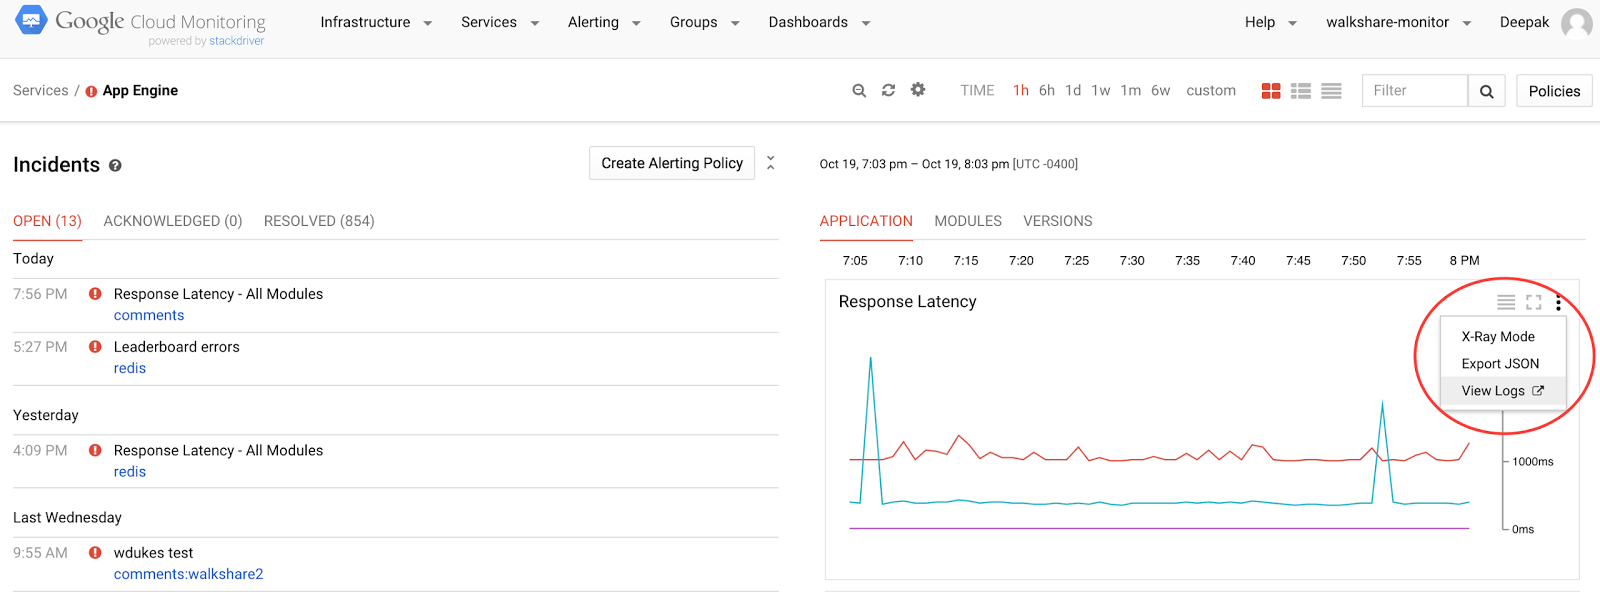
We are also keenly aware of the cost of context-switching between monitoring and logging tools when you're trying to investigate an issue. So we're working hard to make it easy for you to drill down and navigate information naturally. Starting today, you can easily view the specific log entries that underlie events displayed in charts. We’ve added a link in chart menus that will take you to Cloud Logging to review relevant logs. For example, if you are seeing spikes in the Response Latency for App Engine and want to see details on the requests and handlers that have high latency, you can quickly go to a filtered view in the logs viewer:
This launch will help Developers and Ops administrators identify trends based on log data that they would have otherwise missed. It will help them solve problems faster by creating granular metrics and easily drilling down to logs when resolving an incident. These are key advances in our journey to make ops easy in the cloud and we look forward to sharing more with you soon!
We invite you to test out these new features, and welcome your feedback. Please send feedback through the Developers Console or directly at [email protected].
- Posted by Deepak Tiwari, Product Manager, Google Cloud Platform