Author Archives: Nick Mihailovski

“Up and to the right” with Data Studio

Millions of people from global enterprises, small businesses, governments and educational institutions are choosing Data Studio to make data-driven decisions. Over the last year, people used Data Studio to monitor ad performance, track brand performance, visualize student progress, and build machine learning models. 
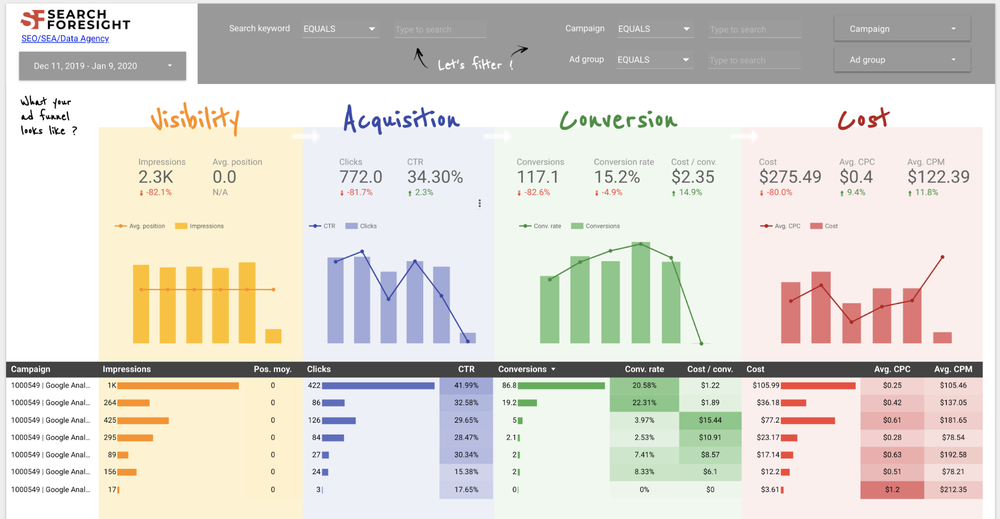
Google Ads monitoring report by Search Foresight

In 2019, we launched more than 80 new features and over 50 new connectors to data. A heartfelt thanks to our users and developers who made 2019 a year to remember. Here are a few highlights. 


Visual Analysis

Throughout the year, we invested in visual analysis allowing faster data exploration and insights discovery. We made it possible to turn a chart into a filter using chart interaction controls. We also launched cross-chart interactions and drill downs. These investments, alongside updates like optional metrics, give users the tools they need to explore and interact with their data.
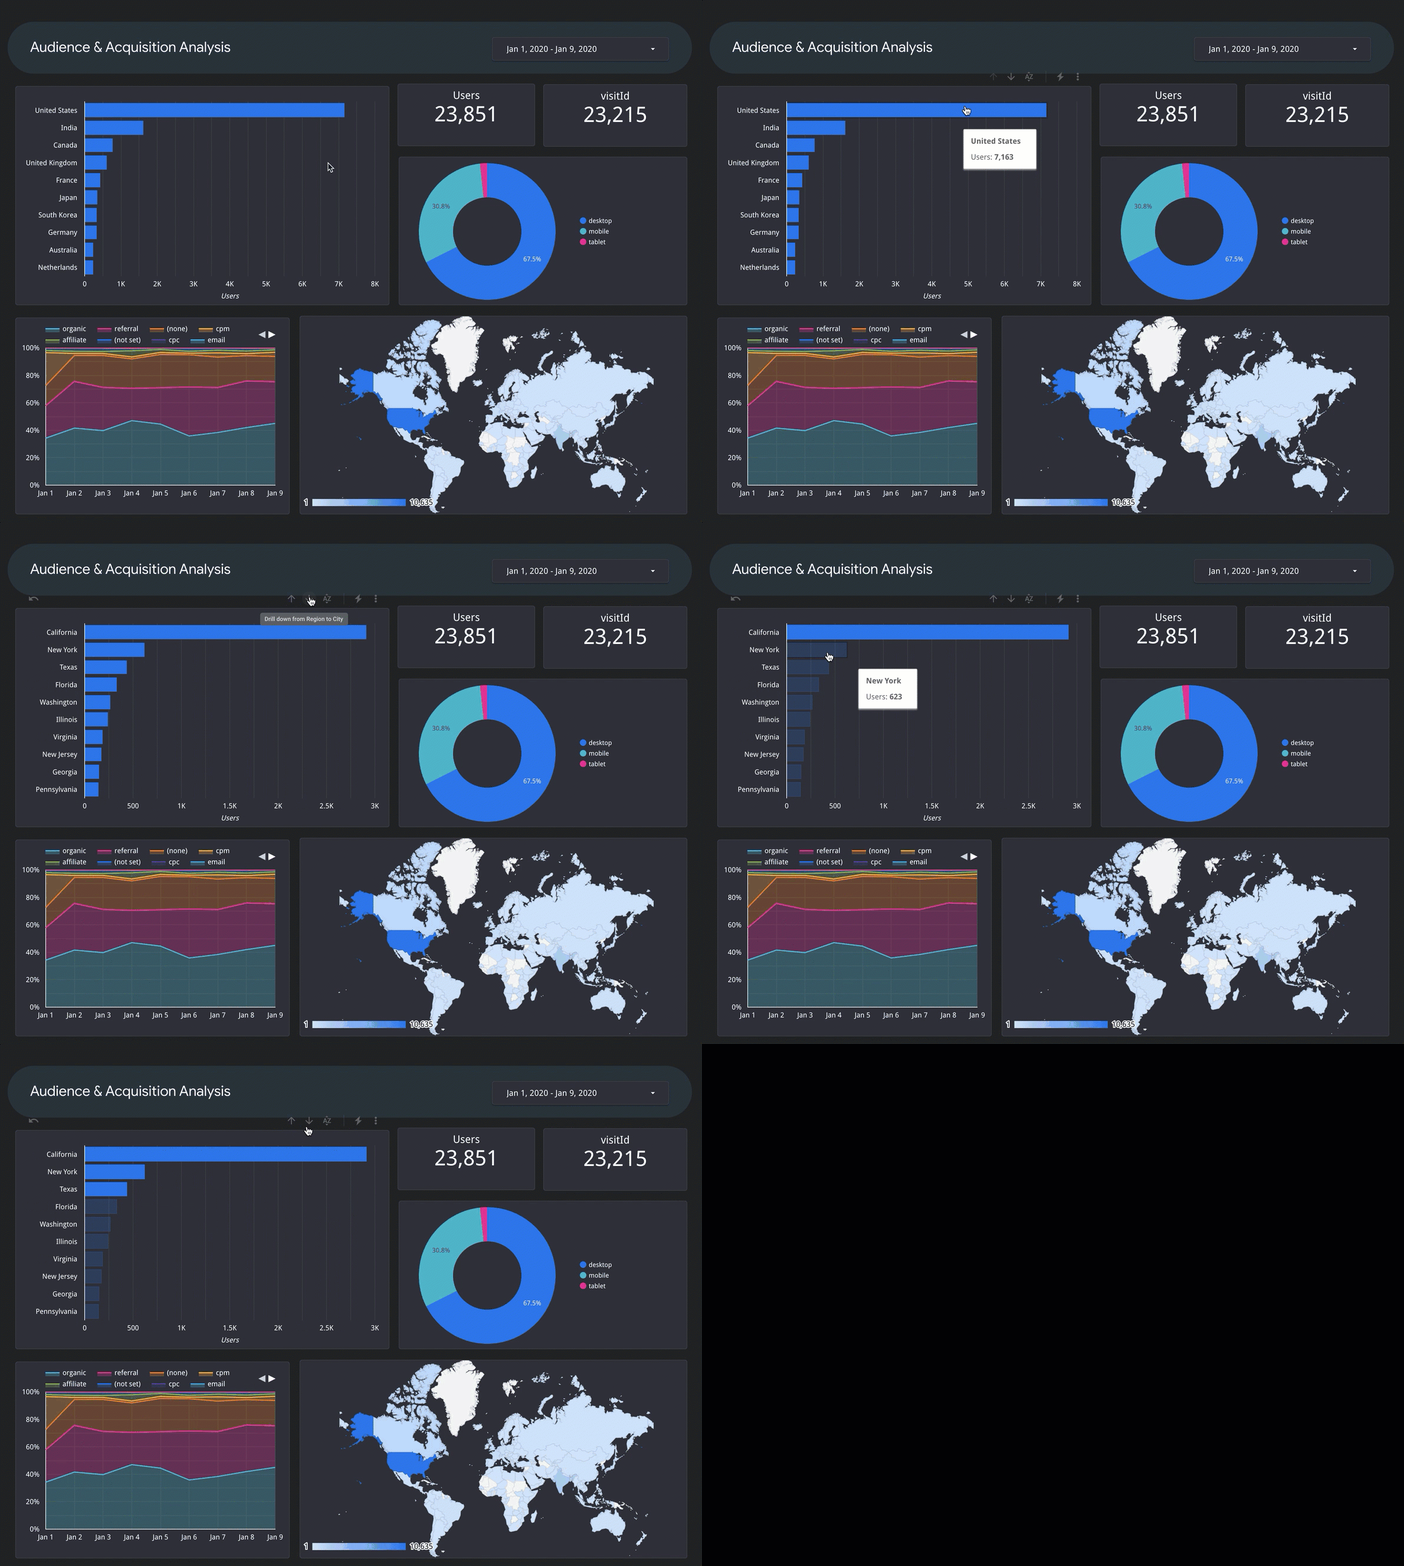
Drill Down GIF

Fast performance through In-Memory BI Engine

Having the right tools to interact with and analyze data is critical but if report performance is slow, analyzing and visualizing large data sets can be frustrating. In collaboration with the Google Cloud BigQuery team, we launched BI Engine to bring sub second performance to Data Studio. BI Engine is an in-memory analysis service that integrates with your BigQuery data to return blazingly fast results in Data Studio. No more waiting for the page to load!
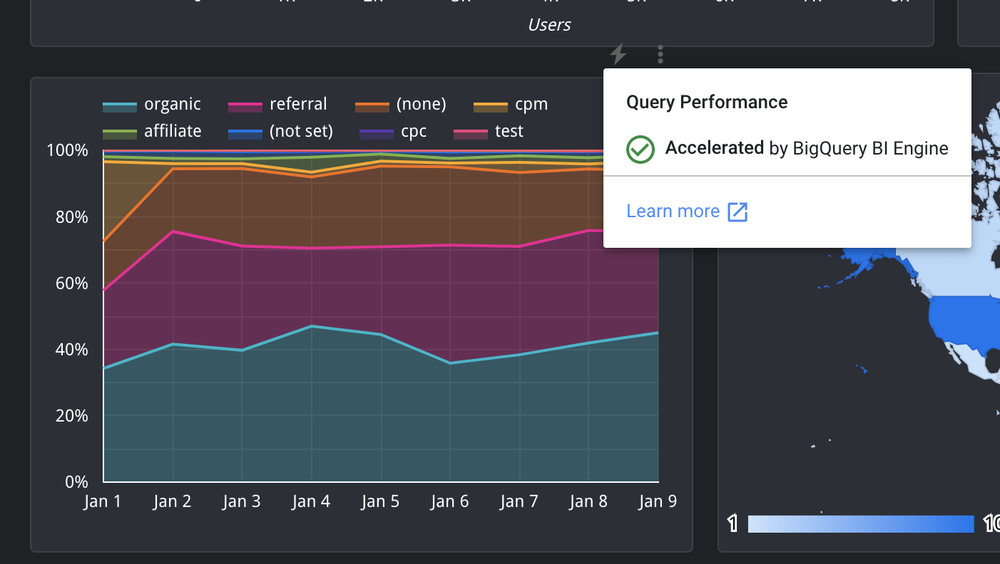
BI Engine

Scheduled PDF export

Listening to what our users need has always been a priority for the Data Studio team. Two of the top requests we heard from our users was the need to create PDFs and schedule emails of reports. Users can now do both. We’re happy to let you know that as of last week you can now set a custom schedule for scheduled emails. Learn more.
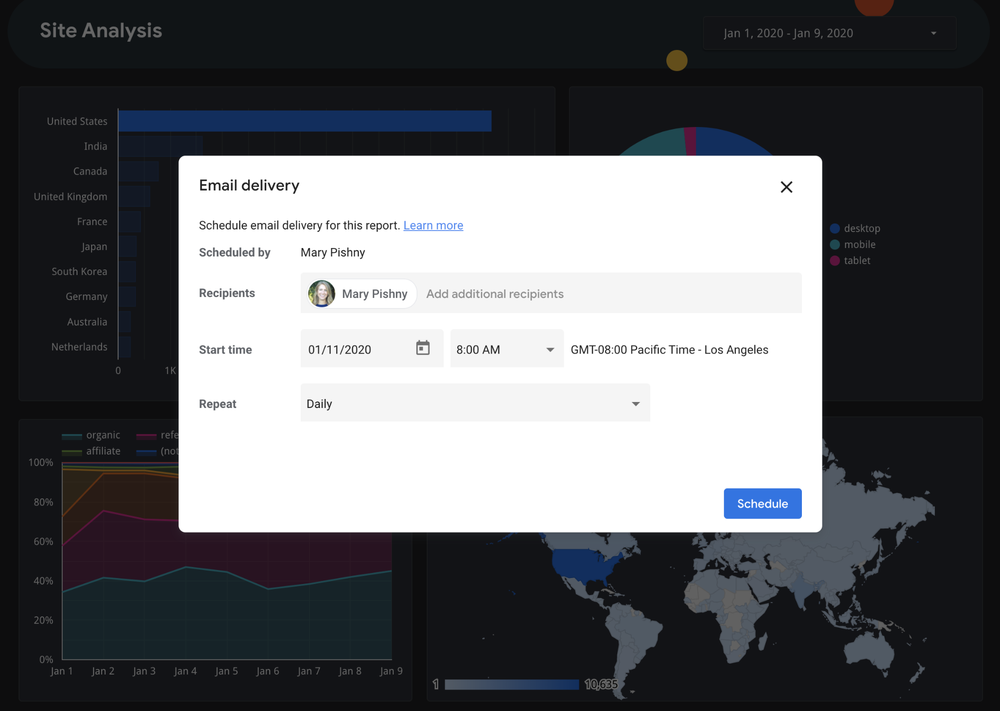
Email Delivery

Conditional formatting

We recently launched conditional formatting, which allows users to apply formatting based on a set of rules, making it easier to tell a story with your data. We’re continuing to invest in conditional formatting and recently added  AND and OR conditions to support compound conditions. Learn more.
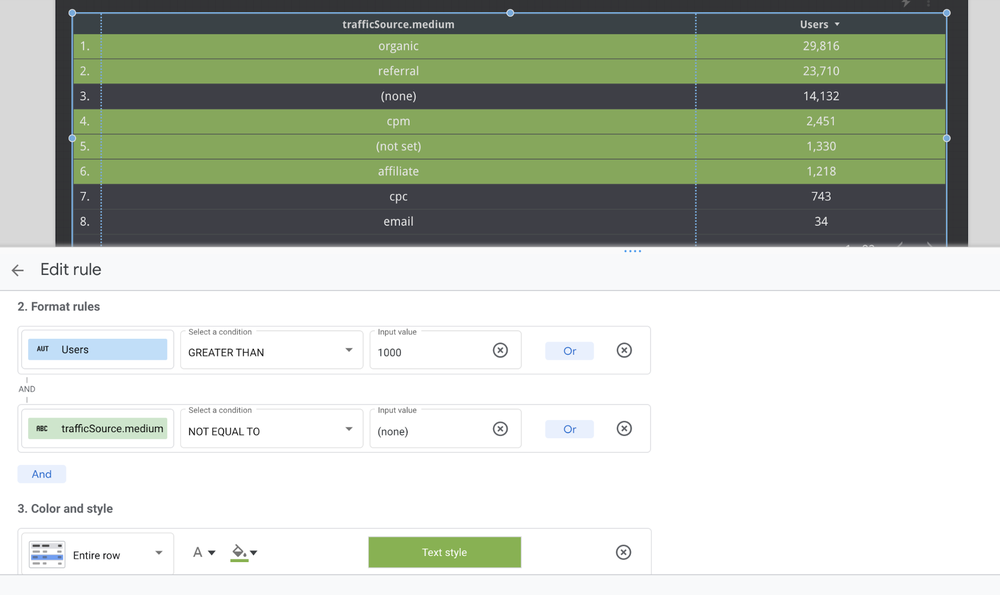
Conditional formatting

In 2020 the Data Studio team is committed to delivering a great product that helps our users make better decisions with data. To stay in the loop on what’s happening in Data Studio, subscribe to email updates under Settings > Marketing Preferences or check our Help Center each week to learn “What’s new.”