But what if you don’t know exactly which thresholds to use, or what “too high” really means? What if instead, you just want to notify when things change from their norm?
For that, we’re introducing the ability to alert on a metric’s rate of change. Instead of choosing a threshold for a certain metric (e.g. “notify me when it crosses 20”), you can now specify a percentage change instead (e.g. “notify me when it changes by more than 30% compared to it’s previous values”). This new alert condition type is especially useful for “stable” metrics that are expected to remain within a certain range and not change too abruptly for extended periods of time, such as latency, QPS and error ratios.
Understanding how metric rate of change conditions are evaluated
Suppose you want to be alerted when disk usage increases by over 30% in a time period of 15 minutes or less (details of how to configure this in the next section). Here’s how this condition is evaluated:
- Every minute at time T, we compute a simple 10 minute moving average for the metric in question (in this case, disk usage), at times T and T minus 15 minutes.
- We then check the difference between the two, and if it exceeds the percentage specified, the alert condition is triggered.
Note that the 15 minute period is used as an example and is configurable. However, the 10 minute moving average is fixed, and is used to smooth the metric and prevent false positives. Without this smoothing function, a quick spike in the metric would trigger the alert condition even if it’s very short lived and resolves itself instantly.
You can configure the increase and decrease of a metric separately, so in the above example a drop of 30% or more would NOT trigger this alert condition.
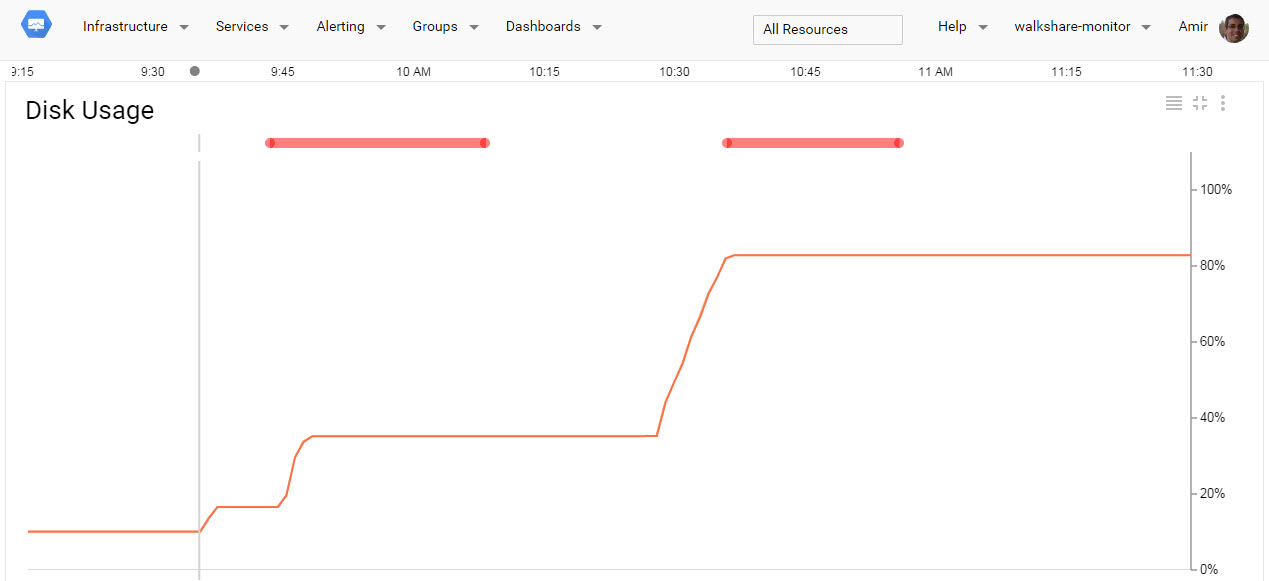
Lets look at the visual example above, using the same condition previously described. As you can see, disk usage starts rising a little after 9:30 (where the gray vertical line is), but the alert condition isn’t triggered yet since it only increases by 20%. Around 9:45 it increases some more and triggers the condition (the red horizontal line at the top of the graph).
The condition is auto resolved at around 10:10, since looking back 15 minutes doesn’t yield any increase of 30% or greater. In other words, the metric has stabilized for 15 minutes. The condition is again triggered a little after 10:30 when disk usage increases from about 40% to over 80%.
Configuring metric rate of change alerting conditions
To create a rate of change alerting condition, simply choose “Metric Rate of Change” from the “Add Condition” menu when creating or editing an alerting policy. Like other condition types, Metric Rate of Change can be combined with other conditions to create a multi-condition alerting policy.
When configuring this condition, you can choose the metric, whether to trigger on an increase or decrease, the percent of increase or decrease that would trigger the condition, and the time window to examine for change. The screenshot below shows the condition we examined in the previous example.

Note: you should take into account metric changes related to time of day, to avoid false notifications. So for example, if average QPS increases tenfold in the morning, this might unnecessarily trigger alert conditions that check for increased QPS activity.
Conclusion
Alerting on a metric’s rate of change gives you more flexibility when monitoring dynamic systems without the need to explicitly define – and maintain – static thresholds. These conditions adapt to the way your system behaves, part of our ongoing effort to provide you with a monitoring system that requires less maintenance, so you have more time to innovate. Give it a try – look for a stable metric that should remain within a given range, and configure a percentage increase or decrease that would signal a change that’s worth investigating. You can read more about setting up alerts here.
Please send us an email and let us know what you think. Your feedback helps us improve.
- Posted by Amir Hermelin, Product Manager