Category Archives: Google Cloud Platform Blog

Product updates, customer stories, and tips and tricks on Google Cloud Platform

New Google Cloud Platform Education Grants offer free credits to students


We are excited to announce Google Cloud Platform Education Grants for computer science faculty and students. Starting today, faculty in the United States who teach courses in computer science or related subjects can apply for free credits for students to use across the full complement of Google Cloud Platform tools, without having to submit a credit card. These credits can be used anytime during the 2016-17 academic year.

Cloud Platform already powers innovative work by young computer scientists. Consider the work of Duke University undergrad Brittany Wenger. After watching several women in her family suffer from breast cancer, Brittany used her knowledge of artificial intelligence to create Cloud4Cancer, an artificial neural network built on top of Google App Engine. Medical professionals upload scans of benign and malignant breast cancer tumors. From these inputs, Cloud4Cancer has learned to distinguish between healthy and unhealthy tissue, providing health care professionals with a powerful diagnostic tool in the fight against cancer.

Familiarizing students with Cloud Platform will also make them more competitive in the job market. Professor Majd Sakr is a teaching professor in the Department of Computer Science at Carnegie Mellon University. In his experience, students that have access to public cloud infrastructure gain valuable experience with the software and infrastructure used by today’s employers. In addition, student projects can benefit from the sheer scale and scope of Google Cloud Platform’s infrastructure resources.

Google Cloud Platform offers a range of tools and services that are unique among cloud providers, for example:

  • Google App Engine is a simple way to build and run an application without having to configure custom infrastructure.
  • Google BigQuery is a fully managed cloud data warehouse for analyzing large data sets with a familiar, SQL-like interface.
  • Cloud Vision API allows computer science students to incorporate Google’s state-of-the-art image recognition capabilities into the most basic web or mobile app.
  • Cloud Machine Learning is Google’s managed service for machine learning that lets you build machine learning models on any type or size of data. It’s based on TensorFlow, the most popular open-source machine learning toolkit on GitHub, which ensures your machine learning is not locked into our platform.


We look forward to seeing the novel ways computer science students use their Google Cloud Platform Education Grants, and are excited to share their work on this blog.

Computer science faculty can apply for Education Grants today. These grants are only available to faculty based in the United States, but we plan to extend the program to other geographies soon. Once submissions are approved on our end, faculty will be able to disperse credits to students. For US-based students out there interested in taking GCP for a spin, encourage your department to apply! If you want to get started immediately, there’s also our free-trial program.

Students and others interested in Google Cloud Platform for Higher Education should complete the form to register their interest and stay updated about the latest from Cloud Platform, including forthcoming credit programs. For more information on GCP and its uses for higher education, visit our Cloud Platform for Higher Education webpage.


A better way to bootstrap MongoDB on Google Cloud Platform


We like to think that Google Cloud Platform is one of the best places to run high-performance, highly-available database deployments and MongoDB is no exception. In particular, with an array of standard and customizable machine types, blazing fast persistent disks and a high performance global network, Google Compute Engine is a great option for MongoDB deployments, which can then be combined with managed big data services like Google BigQuery, Cloud Dataproc and Cloud Dataflow to support all manner of modern data workloads.

There are a number of ways to deploy MongoDB on Cloud Platform, including (but not limited to):
  • Creating Compute Engine instances and manually installing/configuring MongoDB
  • Using Google Cloud Launcher to quickly create and test drive a MongoDB replica set
  • Provisioning Compute Engine instances and using MongoDB Cloud Manager to install, configure and manage MongoDB deployments
Today we’re taking things one step further and introducing updated documentation and Cloud Deployment Manager templates to bootstrap MongoDB deployments using MongoDB Cloud Manager. Using the templates, you can quickly deploy multiple Compute Engine instances, each with an attached persistent SSD, that will download and install the MongoDB Cloud Manager agent on startup. Once the setup process is complete, you can head over to MongoDB Cloud Manager and deploy, upgrade and manage your cluster easily from a single interface.

By default, the Deployment Manager templates are set to launch three Compute Engine instances for a replica set, but they could just as easily be updated to launch more instances if you’re interested in deploying a sharded cluster.

Check out the documentation and sample templates to get started deploying MongoDB on Cloud Platform. Feedback is welcome and appreciated; comment here, submit a pull request, create an issue or find me on Twitter @crcsmnky and let me know how I can help.

Build your own scalable, location analysis platform with Google Cloud Platform and Maps APIs


When our customers work with telemetry data from large fleets of vehicles or big deployments of sensors that move about in the world, they typically have to combine multiple Google APIs to capture, process, store, analyze and visualize their data at scale. We recently built a scalable geolocation telemetry system with just Google Cloud Pub/Sub, Google BigQuery and the Google Maps APIs. The solution comes with a full tutorial, Docker images you can use straight away and some sample data to test it with.
The sample solution retrieves data using BigQuery and renders it as a heat map indicating density.
We chose Google Cloud Pub/Sub to handle the incoming messages from vehicle or device sensors as it is a serverless system that scales to handle many thousands of messages at once with minimal configuration. Just create a topic and start adding messages to it.

Google BigQuery offers petabyte scale, serverless data warehousing and analytics  ideal for large fleets of vehicles that will send thousands of messages a second, year after year. Further, BigQuery can perform simple spatial queries to select by location or do geofencing on vast datasets  all in a few seconds.

The Google Maps APIs add an extra dimension to telemetry data by converting raw GPS position into human-readable structured address data, as well as adding other really useful local context such as elevation (great for fuel consumption analysis) and local time-zone (maybe you want to just see locations recorded during working hours for a given location). Google Maps also provides an interface with which the majority of your staff, customers or users are familiar.

Finally we packaged our solution using Docker so that you can just take it and start working with it right away. (Of course if you’d rather just run the code on a server or your local machine you can do this as well; it’s written in Python and can be run from the command line.)

To get started, read the solution document, then head on over to the tutorial to explore the sample application and data. Once you’ve had a play, fork the code on GitHub and start working with your own telemetry data!


Bob Loblaw’s Log Blog: this week on Google Cloud Platform


With apologies to Arrested Development fans out there, the Google Cloud Platform community has amassed a whole host of posts about logs recently — enough for a Bob Loblaw log blog.

Maybe you don’t think logging is the most exciting feature, but that doesn’t make it any less important. That’s why Cloud Platform’s integrated monitoring suite, Google Stackdriver, includes logging as part of the base package. Check out Google Developer Advocate Aja Hammerly’s explanation of what Stackdriver Logging can do, how to set it up and what to do when it’s no longer enough (hint: export the logs into BigQuery).

Stackdriver Logging is turned on by default for applications running on Google App Engine, but it can also be used with other apps and services. For example, former Googler Joe Beda uses Stackdriver Logging to augment Docker logs  to prevent them from filling up a disk, and from being deleted along with their associated container. Likewise, John Hamminck, chief evangelist at Treasure Data, tackles streaming logging with Fluentd, Kubernetes and GCP. And then there’s Ido Shamun, co-founder for @ElegantMonkeys, who streams the logs from his hapi.js stack running on App Engine to GCP Logging. “Now all the logs are fully structured in GCP Logging and I can create custom metrics and get insights out of my logs,” he writes.

Logs are also a crucial debugging tool. For the uninitiated, Romin Imani offers this tutorial on using Stackdriver Monitoring to debug a running application using the Debugger and Trace features, analyzing application logs and adding log points to an application. Oh, and about those log points…. You can now add log points on the fly, to a running application, with no need to restart.

To quote Buster, “This party is going to be Off. The. Hook.”

Filtering and formatting fun with gcloud, GCP’s command line interface


The gcloud command line tool is your gateway to manage and interact with Google Cloud Platform. Being a command line tool, you're probably already thinking of using system tools like cat|sed|awk|grep|cut to extract out all the info gcloud offers. In fact, gcloud itself offers a variety of options that will help you avoid having to use those commands. In this article, we describe a couple of options you can use to automatically parse and format the results. We’ll also show you a how to chain these commands together in a bash or powershell script to extract the embedded data.

We’re going to demonstrate three gcloud features which you can extend and combine in a variety of ways:
  • filters to return a subset of the result
  • format to change how that data is rendered
  • projections to apply transforms or logic directly to the data returned

Format

Let's start off by formatting a simple command that you are already familiar with that lists the projects to which you have access:

1. gcloud projects list
PROJECT_ID            NAME          PROJECT_NUMBER
canvas-syntax-130823  scesproject2  346904393285
windy-bearing-129522  scesproject1  222844913538

Now let’s see the raw out output of this command by asking for the raw JSON format of the response:

2. gcloud projects list --format="json"

[
  {
    "createTime": "2016-04-28T22:33:12.274Z",
    "labels": {
      "env": "test",
      "version": "alpha"
    },
    "lifecycleState": "ACTIVE",
    "name": "scesproject1",
    "parent": {
      "id": "297814986428",
      "type": "organization"
    },
    "projectId": "windy-bearing-129522",
    "projectNumber": "222844913538"
  },
  {
    "createTime": "2016-05-11T03:08:13.359Z",
    "labels": {
      "env": "test",
      "version": "beta"
    },
    "lifecycleState": "ACTIVE",
    "name": "scesproject2",
    "parent": {
      "id": "297814986428",
      "type": "organization"
    },
    "projectId": "canvas-syntax-130823",
    "projectNumber": "346904393285"
  }
]


Seeing the raw JSON now lets us select the resources we're interested in and the formats we'd like. Let's display the same response in a formatted box sorted by createdTime and only select certain properties to display:

3. gcloud projects list --format="table[box,title='My Project List'](createTime:sort=1,name,projectNumber,projectId:label=ProjectID,parent.id:label=Parent)"

┌────────────────────────────────────────────────────────────────────────────────────────────────┐
│                                        My Project List                                         │
├──────────────────────────┬──────────────┬────────────────┬──────────────────────┬──────────────┤
│       CREATE_TIME        │     NAME     │ PROJECT_NUMBER │      ProjectID       │    Parent    │
├──────────────────────────┼──────────────┼────────────────┼──────────────────────┼──────────────┤
│ 2016-04-28T22:33:12.274Z │ scesproject1 │ 222844913538   │ windy-bearing-129522 │ 297814986428 │
│ 2016-05-11T03:08:13.359Z │ scesproject2 │ 346904393285   │ canvas-syntax-130823 │ 297814986428 │
└──────────────────────────┴──────────────┴────────────────┴──────────────────────┴──────────────┘
Tip: you can derive the JSON path value for a property by using --format='flattened' flag.

Say you don't want a formatted box, just a table without a border with a simple display of the date property in the format year-month-day:

4. gcloud projects list --format="table(createTime.date('%Y-%m-%d'),name,projectNumber,projectId)"
CREATE_TIME  NAME          PROJECT_NUMBER  PROJECT_ID
2016-05-11   scesproject2  346904393285    canvas-syntax-130823
2016-04-28   scesproject1  222844913538    windy-bearing-129522

Now let's do some more complex formatting. To see this, list out the Compute Engine zones and peek at the JSON:

5. gcloud compute zones list --format="json"
{
    "creationTimestamp": "2014-05-30T18:35:16.514-07:00",
    "description": "us-central1-a",
    "id": "2000",
    "kind": "compute#zone",
    "name": "us-central1-a",
    "region": "us-central1",
    "selfLink": "https://www.googleapis.com/compute/v1/projects/windy-bearing-129522/
     zones/us-central1-a",
    "status": "UP"
  },

Note the selfLink. It's the fully qualified name that you'd like to parse. gcloud can help here too by giving you functions to select the JSON value and then extract and parse it. Let’s grab the last part of the URL segment of selfLink by using the selfLink.scope() function:

6. gcloud compute zones list --format="value(selfLink.scope())"
us-central1-a

Alternatively, you can extract the value using .basename():

7. gcloud compute zones list --format="value(selfLink.basename())"
us-central1-a

Suppose you want to extract part of the selfLink starting from the /projects path:

8. gcloud compute zones list --format="value(selfLink.scope(projects))"
windy-bearing-129522/zones/us-central1-a

Some GCP objects have multi-valued resources and we often need to enumerate them. For example, consider listing out all scopes enabled for a given GCE instance:

9. gcloud compute instances list --format="json"

"serviceAccounts": [
      {
        "email": "[email protected]",
        "scopes": [
          "https://www.googleapis.com/auth/devstorage.read_only",
          "https://www.googleapis.com/auth/logging.write",
          "https://www.googleapis.com/auth/monitoring.write",
          "https://www.googleapis.com/auth/cloud.useraccounts.readonly"
        ]
      }
    ],


What we actually want to do here is flatten the multi-valued resources:

10. gcloud compute instances list --format="flattened(name,serviceAccounts[].email,serviceAccounts[].scopes[].basename())"

name:                         instance-1
serviceAccounts[0].email:     [email protected]
serviceAccounts[0].scopes[0]: devstorage.read_only
serviceAccounts[0].scopes[1]: logging.write
serviceAccounts[0].scopes[2]: monitoring.write
serviceAccounts[0].scopes[3]: cloud.useraccounts.readonly


Or flatten multi-values to a separate line per value:


11. gcloud compute instances list --filter=name:instance-1 --flatten="serviceAccounts[].scopes[]" --format="csv(name,id,serviceAccounts.email,serviceAccounts.scopes.basename())"


name,id,email,scopes
instance-1,763097360168409044,[email protected],
devstorage.read_only
instance-1,763097360168409044,[email protected],
logging.write
instance-1,763097360168409044,[email protected],
monitoring.write
instance-1,763097360168409044,[email protected],
servicecontrol
instance-1,763097360168409044,[email protected],
service.management

Here is the same information in an easy-to-read, structured format:

12. gcloud compute instances list --filter=name:instance-1 --format="table[box,no-heading](name,id,serviceAccounts:format='table[box,no-heading](email,scopes:format="table[box,no-heading](.)")')"

┌────────────┬────────────────────┐
│ instance-1 │ 763097360168409044 │
└────────────┴────────────────────┘
    ┌────────────────────────────────────────────────────┐
    │ [email protected]│
    └────────────────────────────────────────────────────┘
        ┌──────────────────────────────────────────────────────┐
        │ https://www.googleapis.com/auth/devstorage.read_only │
        │ https://www.googleapis.com/auth/logging.write        │
        │ https://www.googleapis.com/auth/monitoring.write     │
        │ https://www.googleapis.com/auth/servicecontrol       │
        │ https://www.googleapis.com/auth/service.management   │
        └──────────────────────────────────────────────────────┘


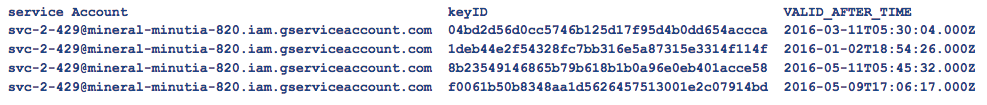
The final formatting example parses a multi-valued resource to display the service account keys with the service account for the following raw output:

13. gcloud beta iam service-accounts keys list --iam-account [email protected] --project mineral-minutia-820 --format="json"
[
  {
    "name": "projects/mineral-minutia-820/serviceAccounts/svc-2-429@mineral
-minutia-820.iam.gserviceaccount.com/keys/
04bd2d56d0cc5746b125d17f95d4b0dd654accca",
    "validAfterTime": "2016-03-11T05:30:04.000Z",
    "validBeforeTime": "2026-03-09T05:30:04.000Z"
  },
  {
    "name": "projects/mineral-minutia-820/serviceAccounts/svc-2-
[email protected]/keys/
1deb44e2f54328fc7bb316e5a87315e3314f114f",
    "validAfterTime": "2016-01-02T18:54:26.000Z",
    "validBeforeTime": "2025-12-30T18:54:26.000Z"
  },
....
]


So use .scope() to extract just the serviceAccount part, then grab the first '/' delimited part with segment(0):

14. gcloud beta iam service-accounts keys list --iam-account [email protected] --project mineral-minutia-820 --format="table(name.scope(serviceAccounts).segment(0):label='service Account',name.scope(keys):label='keyID',validAfterTime)"

(click to enlarge)

Filters

Let's talk about filters. Filters allow you to select only the resources to which you want to apply formatting.For example, suppose you labeled your resource (projects, VM's, etc.) with a specific name, and you want to list only those projects where the labels match specific values (e.g. label.env='test' and label.version=alpha):

15. gcloud projects list --format="json" --filter="labels.env=test AND labels.version=alpha"

[
  {
    "createTime": "2016-04-28T22:33:12.274Z",
    "labels": {
      "env": "test",
      "version": "alpha"
    },
    "lifecycleState": "ACTIVE",
    "name": "scesproject1",
    "parent": {
      "id": "297814986428",
      "type": "organization"
    },
    "projectId": "windy-bearing-129522",
    "projectNumber": "222844913538"
  }
]


You can also apply projections on keys. In the example below, the filter is applied on the createTime key after the date formatting is set:

16. gcloud projects list --format="table(projectNumber,projectId,createTime)" --filter="createTime.date('%Y-%m-%d', Z)='2016-05-11'"
PROJECT_NUMBER  PROJECT_ID            CREATE_TIME
346904393285    canvas-syntax-130823  2016-05-11T03:08:13.359Z

Notice the filter selected above actually references a JSON structure (labels.env=test).You can of course use that and combine it in any number of ways.

Projection transforms

Projection transforms allow you to alter the value rendered directly. We already showed several examples above (e.g., .extract(), .scope(), .basename(), .segment()). To note, one interesting capability of transforms is that you can combine and chain them together with .map() and and apply them to multi-valued data.

For example, the following applies conditional projection to the parent.id key such that if the parent.id key exists, the output is "YES" and otherwise its "NO". This is a quick way to see which of your projects meets a specific criteria (in this case, is it part of the Organization Node)

17. gcloud projects list --format="table(projectId,parent.id.yesno(yes="YES", no=”NO”):label='Has Parent':sort=2)"
PROJECT_ID                Has Parent
mineral-minutia-820       NO
fabled-ray-104117         YES
rk-test-0506              YES
user2proj1                YES
user2project2             YES

18. gcloud compute instances list --format="flattened(name,serviceAccounts[].email,serviceAccounts[].scopes.map().scope())"
name:                         instance-1
serviceAccounts[0].email:     [email protected]
serviceAccounts[0].scopes[0]: devstorage.read_only
serviceAccounts[0].scopes[1]: logging.write
serviceAccounts[0].scopes[2]: monitoring.write
serviceAccounts[0].scopes[3]: cloud.useraccounts.readonly

Scripts

Finally, let's see how we can combine gcloud commands into a script that will help us easily extract embedded information. In the following example, we list all the keys associated with all your projects’ service accounts.To do this, we first need to enumerate all the projects, then for each project, get all of its service accounts.Finally, for each service account, we list all the keys created against it. This is basically a nested loop to iterate over:

As a bash script:

#!/bin/bash
for project in  $(gcloud projects list --format="value(projectId)")
do
  echo "ProjectId:  $project"
  for robot in $(gcloud beta iam service-accounts list --project $project --format="value(email)")
   do
     echo "    -> Robot $robot"
     for key in $(gcloud beta iam service-accounts keys list --iam-account $robot --project $project --format="value(name.basename())")
        do
          echo "        $key" 
     done
   done
done

Or as Windows PowerShell:

foreach ($project in gcloud projects list --format="value(projectId)")
{
  Write-Host "ProjectId: $project"
  foreach ($robot in  gcloud beta iam service-accounts list --project $project --format="value(email)")
  {
      Write-Host "    -> Robot $robot"
      foreach ($key in gcloud beta iam service-accounts keys list --iam-account $robot --project $project --format="value(name.basename())")
      {
        Write-Host "        $key" 
      }
  }
}


You'll also often need to parse response fields into arrays for processing. The following example parses the service account information associated with an instance into an array for easy manipulation. Notice the serviceAccounts[].scope field is multi-valued within the csv and delimited by a semicolon since we defined "separator=;". That is, each response line from the gcloud command below will be in the form name,id,email,scope_1;scope_2;scope_3. The script below essentially parses the response from example 12 above:

#!/bin/bash
for scopesInfo in $(
    gcloud compute instances list --filter=name:instance-1 
        --format="csv[no-heading](name,id,serviceAccounts[].email.list(),
                      serviceAccounts[].scopes[].map().list(separator=;))")
do
      IFS=',' read -r -a scopesInfoArray<<< "$scopesInfo"
      NAME="${scopesInfoArray[0]}"
      ID="${scopesInfoArray[1]}"
      EMAIL="${scopesInfoArray[2]}"
      SCOPES_LIST="${scopesInfoArray[3]}"

      echo "NAME: $NAME, ID: $ID, EMAIL: $EMAIL"
      echo ""
      IFS=';' read -r -a scopeListArray<<< "$SCOPES_LIST"
      for SCOPE in  "${scopeListArray[@]}"
      do
        echo "  SCOPE: $SCOPE"
      done
done


Hopefully, this has given you ideas for how to effectively filter and format gcloud command output. You can apply these techniques and extend them to any gcloud response  just look at the raw response, think about what you want to do, and then format away!

Stackdriver Debugger: add application logs on the fly with no restarts


Here on the Google Stackdriver team, we aim to eliminate repetitive and tedious work, so that you can focus all your time on your task at hand. The latest example is adding ad hoc logs to your application while it's still running, using "logpoints"  an important and critical tool when debugging an application.

Today, adding logs as part of the debugging process goes like this:

You've reviewed the errors and logs, looked at the traces and have compared it all with your code. You have a hypothesis about where the problem's occurring, so you open up your source code, and add new log statements to validate it. You then build, test and re-deploy the code. You repeat this process until you've found the root cause of the error.

With the latest release of Stackdriver Debugger, we've simplified this entire workflow into these simple steps:

Step 1: From a command shell, add a logpoint to your running application using the gcloud beta debug logpoint create command.

Step 2: View the logs page.

That’s it! No need to restart or redeploy.

The debug logpoints command allows you to create, list and delete logpoints. For example, you can create a logpoint as follows:

$ gcloud beta debug logpoints create MarkovServlet.java:114 "Hello seed {seed}"


(click to enlarge)
Stackdriver Debugger will apply the logpoint to all running instances and output the log message the next time that code path is executed.
(click to enlarge)
Logpoints automatically expire after 24 hours or unless they're manually deleted. The performance overhead for a logpoint is the same as a coded-in log statement. The debug command is also agnostic to the number of running instances of your application.

Logpoints are available for Java, Python and Node.js applications running with Stackdriver Debugger enabled.

In addition to creating logpoints, you can use gcloud beta debug command to create, list and delete snapshots, providing you with the stack trace and variables of your running application. For a list of all the supported debug commands, please refer to the Cloud SDK Documentation.

Give it a whirl and let us know if you like it. To learn more about Stackdriver Debugger, please visit the Debugger page.

The need for speed: this week on Google Cloud Platform


When people start using Google Compute Engine, our infrastructure as a service offering, one of the first things they notice is how fast their VMs boot up. Internally, we’ve clocked VM boot times that are anywhere from two to ten times faster than other cloud providers.

So it’s really nice when the world notices, and validates our work with an independent analysis. In a blog, Kasia Hoffman of Cloud66, an application deployment tool provider, compared the speed of VM creation and SSH access across ten cloud providers, and found that Compute Engine leads the pack, by significant margins for many use cases. You can read the whole report here.
Source: Wikimedia Commons
We also like to do things that are usually slow, fast. Cloud-based cold storage has emerged as a great way to store infrequently used data such as data backups for short money. This Data Center Knowledge report compares cold storage from the three leading providers, including our own Google Cloud Storage Nearline. The takeaway here is that just because you won’t access the data frequently doesn’t mean you won’t want to access it fast when you need it. With Nearline,  you can expect to see data retrieval begin in as little as one second.

Finally, we love stories about how GCP helps folks get things done, fast. With a new site launch right around the corner, Dane Tidwell describes his last-minute decision to switch out the ecommerce engine for the web site for WooCommerce plus WordPress running on GCP. “But hoorah, it works,” he writes. Hoorah, indeed.

Six things Stackdriver brings to the DevOps table


As someone for whom DevOps and sysadmin tasks are only part of my job, having all the tools I commonly need in one place is a huge advantage. Stackdriver gives me exactly that. Monitoring, logging, debugging and error reporting are all integrated and provide the essential tools I need to keep my websites up and healthy. I also like that Stackdriver doesn’t require me to have deep system administration knowledge to set up basic monitoring. With minimal effort, I’m confident that I'll be notified if my application has an issue.

I gave a talk at Google I/O 2016 titled "Just Enough Stackdriver to Sleep At Night" that gives an overview of what I like about Stackdriver. You can watch the whole thing, but this post covers some of the highlights.

Monitoring and uptime monitoring

Setting up basic monitoring is one of the most common DevOps tasks. Stackdriver offers uptime monitoring for URLs, App Engine applications and modules, load balancers or specific instances. Uptime checks can run over HTTP, HTTPS, UDP or TCP and you can customize how often the check runs. Most of the time, I use a URL check against the root of my application or another vital endpoint, and once you've set up the check you can configure how you want to be notified. In addition to common notification methods like email and SMS, Stackdriver supports notification via messaging platforms like Hipchat, Slack, and Campfire, as well as PagerDuty and the Google Cloud Console mobile app. And if none of these options works for your team, there's a configurable webhook.

Application-level monitoring

Another thing DevOps teams want is application-level monitoring. Stackdriver can monitor many common tools/frameworks including nginx, Apache, Memecached, MongoDB, MySQL, PostgreSQL and RabbitMQ. To begin monitoring these applications, all you need to do is add a config file to your system and restart the monitoring agent. Of course Stackdriver supports custom monitoring if your particular stack isn't already supported.

If your application's running on Google Cloud Platform, Stackdriver automatically looks at open ports, running services and instance names to determine if you're running any common tools, and if so, it makes metrics for those tools available for monitoring. For example, if you're running a MySQL server on Google Compute Engine with an instance called "MySQL" and the mysql process is running, Stackdriver will detect that and add the MySQL metrics to the monitoring options.

And if you're using Google App Engine, Stackdriver supports request-level latency monitoring. You can look at latency for a particular class of responses, say 5xx errors or 2xx successful responses. You can also look at the overall average or the 95% or 5% case. This is particularly helpful when your request latency occasionally has outliers.
(click to enlarge)

System-level monitoring

Stackdriver also supports system-level monitoring. You can monitor disk usage and I/O, memory usage and swap, CPU usage and steal, processes (running, sleeping, zombies), network traffic and open TCP connections. System-level monitoring can alert you if disks are filling up too quickly or if the CPU is spiking outside of the acceptable range.

Monitoring some parts of the system requires installing the Stackdriver monitoring agent on the machine. Installing the agent only takes a few minutes and there's a cookbook for Chef, a module for Puppet and a role for Ansible as well.

Logging

Much like Stackdriver Monitoring, Stackdriver Logging works on both Cloud Platform and Amazon Web Services. It's set up by default for App Engine, and also captures some Google Container Engine events. Installing the Logging agent on your Compute Engine VMs is simple. Additionally, there are packages available for many web frameworks to integrate Stackdriver Logging with your application.

If your framework isn't supported or you need custom events, you can use the Stackdriver Logging API to send events directly to Stackdriver. The API also supports viewing entries and managing logging for your project.

I like that the Stackdriver Logging UI supports searching by time interval, response code, log level, log source and other things that I find helpful. In the past, I've had to write code to do this level of filtering. And if search capabilities of the Logging UI aren't sufficient, you can export your logs to Google BigQuery, which can quickly query, aggregate or filter several terabytes of data. You can also save your queries with BigQuery to repeat them later and to share results with others.
(click to enlarge)

Error reporting

One of the problems I've often run into is the idea of a "normal error." Most applications seem to have an edge case or other error condition that causes an error, but that isn't a priority to fix. This is why I like Stackdriver Error Reporting. Stackdriver Error Reporting monitors your application errors, aggregates them, and then alerts you to new errors that arise.

You can use the Error Reporting console to see how many of each error have occured, what versions of your application the error occurred in, and when it was first or last seen. Error Reporting saves a few representative stack traces from the error to help you debug your application. You can also link a specific error to a bug in your bug tracker.

Error Reporting is automatically set up for App Engine applications. It currently supports Java, Python, Javascript, PHP and Go. To use Error Reporting in other environments you can call an API from your application or you can send error events to Stackdriver Logging in a specific format. To receive alerts about new errors you can opt-in from Google Cloud Console.
(click to enlarge)


Debugging

Once you've noticed an error in your application with Error Reporting or Stackdriver Logging, you may need to debug your application to prevent the error from happening again. Stackdriver Debugger can help you here. Instead of hooking up a debugger to the production website (something many of us have done and very few will recommend), Stackdriver Debugger takes a snapshot of the application state at a specified point. The snapshot shows you the call stack and variable values without the need to push instrumented code to production.

To take a snapshot, all you need to do is supply a filename and line number. If you have access to the source code for your application you can upload it to Stackdriver Debugger. You can also point Debugger at a cloud repository or load the source code into the browser locally. When the source code is available you can set snapshot points in Debugger much like you set breakpoints in an IDE. This allows you to see the captured values in the context of the code.

Stackdriver Debugger is automatically enabled for all App Engine applications. Better yet, it doesn't add a large amount of latency to captured requests so your users will likely not notice a performance hit.

Conclusion

You may've been running applications in the cloud for years, but keeping tabs on your application and dealing with errors has usually involved multiple tools from multiple vendors that may or may not share data with each other. Stackdriver provides the tools you need in one place, with one login, and they all integrate together. While looking at an error in Error Reporting you can seamlessly see the related logs in Cloud Logging. You can set up monitoring and alerting on events in Cloud Logging. And once you find problems, debugging them in production is straightforward. Check out Stackdriver when you get a chance and let me know what you think @thagomizer_rb on Twitter.

Your Google Cloud Platform compute options, explained


When choosing to host an application on Google Cloud Platform, one of the first decisions organizations make is which compute offering to choose from: Google Compute Engine (GCE)? Google App Engine (GAE)? Google Container Engine (GKE)? There’s no right answer — it all depends on your developers’ preferences, what kind of functionality the application requires, and the use case.

Our new “Choosing a Computing Option” guide is a convenient way to visualize all these options at a glance, to help you make the best choice for your application. Then again, you may not want to choose. There’s nothing stopping you from choosing multiple compute options, across different application tiers.

And going a step further, if you’re comparing compute options across cloud providers, these resources will be helpful:
If you’ve built an application that spans GCE, GAE and GKE or across other clouds, send us a note on Twitter @googlecloud. We’d love to hear more!

Best practices for Tableau Server on Google Compute Engine


Most Tableau users storing and working with data on Google Cloud Platform have probably heard of Tableau Desktop, which helps you connect to data in Google BigQuery, Cloud SQL and other databases to quickly create visualizations and dashboards for better insight.

Exploring and analyzing data is often only the first step in the analytics journey; at some point everyone wants to share what they’ve created. That’s where Tableau Server comes in. You can create a visualization with Tableau Desktop and then publish it to Tableau Server where it can be shared, edited and interacted with, using any browser.

Installation guidelines

We recently announced support for Tableau Server running on Google Cloud Platform (GCP). For new users, we've created a walkthrough in the Tableau Knowledge Base article “Tableau Server and Cloud Platform Installation Walkthrough” that shows you how to get Tableau Server running on Google Compute Engine.

If you already have a GCP account, here’s a brief overview of what you’ll need to do to get started. You can also read a much more detailed explanation on the Tableau Knowledgebase.
  • Set up a new project and create a new Compute Engine instance
    • Minimum requirements are 8x vCPUs, running Windows Server 2012 R2 Datacenter Edition with 128 GB persistent SSD. You’ll also want to leave API access at its default setting and allow both HTTP and HTTPS traffic.
  • Download the RDP and connect as normal
  • Download a Windows-compatible 14-day free trial version from the Tableau Server Trial Download page
  • Install Tableau Server, following the prompts on the screen
  • Create your administrator account in Tableau Server (this should be prompted automatically after installation)
  • Make sure to download Tableau Desktop as well, so you can connect to data and create visualizations to publish to Tableau Server

Best practices

If you follow these steps, Tableau Server should work out of the gate, but here are some tips to make sure Tableau Server runs as well as it possibly can.
  • While 8 vCPUs and 30GB of memory is the minimum, you’ll see a 75% improvement in performance with 16x vCPUs and 60GB of memory.
  • When scaling instances, it’s preferable to add vCPUs in smaller increments. For example, given a 64 vCPU instance, you’ll get more predictable error and response rates by adding 16x vCPUs compared to 32x vCPUs.
  • 8 vCPUs delivers very poor performance for hundreds of users. The image below shows load testing results for Tableau Server in more detail.
Performance testing of Tableau Server running on GCE (click to enlarge)
  • Doubling your instance disk size will double performance of the overall system (1:1 win).
  • For even more performance, include multiple workers in a cluster to linearly scale performance as the number of users grows. You’ll need to install a domain controller in GCP to use multiple workers in your cluster.
  • Select HTTPs for the best security. Read here about how to get an SSL certificate for Tableau Server.
  • Free certificates are available from letsencrypt.org.
  • If you want to use unencrypted connections, configure the Tableau Server admin password BEFORE enabling public HTTP access to your server.
Once you’ve installed and configured Tableau Server, be sure to watch our free online training videos to learn everything you need to know about installing, administering, using and expanding Tableau Server within your organization.