Sorting through rows and rows of data in a spreadsheet can be overwhelming. That’s why today, we’re rolling out new features in Sheets that make it even easier for you to visualize and share your data, and find insights your teams can act on.
Ask and you shall receive → Sheets can build charts for you
Explore in Sheets, powered by machine intelligence, helps teams gain insights from data, instantly. Simply ask questions—in words, not formulas—to quickly analyze your data. For example, you can ask “what is the distribution of products sold?” or “what are average sales on Sundays?” and Explore will help you find the answers.
Now, we’re using the same powerful technology in Explore to make visualizing data even more effortless. If you don’t see the chart you need, just ask. Instead of manually building charts, ask Explore to do it by typing in “histogram of 2017 customer ratings” or “bar chart for ice cream sales.” Less time spent building charts means more time acting on new insights.
Instantly sync your data from Sheets → Docs or Slides
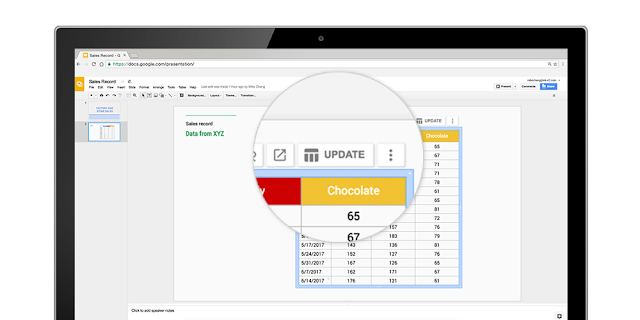
Whether you’re preparing a client presentation or sharing sales forecasts, keeping data up-to-date can be time-consuming, especially if you need to update charts or tables in multiple sources. This is why we made it easier to programmatically update charts in Docs and Slides last year.
Now, we’re making it simple to keep tables updated, too. Just copy and paste data from Sheets to Docs or Slides and tap the “update” button to sync your data.
Even more Sheets updates
We’re constantly looking for ways to improve our customers’ experience in Sheets. Based on your feedback, we’re rolling out more updates today to help teams get work done faster:
These new features in Sheets are rolling out starting today. Learn how Sheets can help you find valuable insights.
One last thing—so that we can focus our efforts on the improvements to charts outlined above, we’re also deprecating one of the lesser-used chart types: the Motion chart. Beginning in July 2017, you will no longer be able to insert or create Motion charts, and, in September 2017, you will no longer be able to edit them.
No earlier than December 2017, any Motion charts still in Sheets will become static images and no longer update when their corresponding data changes.
We recommend trying Bubble charts instead.
Launch Details
Release track:
Editions:
Available to all G Suite editions
Rollout pace:
Gradual rollout (up to 15 days for feature visibility)
Impact:
All end users
Action:
Change management suggested/FYI
More Information
Help Center: Add a chart or graph to a spreadsheet
Help Center: Chart types
Help Center: Add a chart or table to Google Docs or Slides
Launch release calendar
Launch detail categories
Get these product update alerts by email
Subscribe to the RSS feed of these updates
Ask and you shall receive → Sheets can build charts for you
Explore in Sheets, powered by machine intelligence, helps teams gain insights from data, instantly. Simply ask questions—in words, not formulas—to quickly analyze your data. For example, you can ask “what is the distribution of products sold?” or “what are average sales on Sundays?” and Explore will help you find the answers.
Now, we’re using the same powerful technology in Explore to make visualizing data even more effortless. If you don’t see the chart you need, just ask. Instead of manually building charts, ask Explore to do it by typing in “histogram of 2017 customer ratings” or “bar chart for ice cream sales.” Less time spent building charts means more time acting on new insights.
Instantly sync your data from Sheets → Docs or Slides
Whether you’re preparing a client presentation or sharing sales forecasts, keeping data up-to-date can be time-consuming, especially if you need to update charts or tables in multiple sources. This is why we made it easier to programmatically update charts in Docs and Slides last year.
Now, we’re making it simple to keep tables updated, too. Just copy and paste data from Sheets to Docs or Slides and tap the “update” button to sync your data.

Even more Sheets updates
We’re constantly looking for ways to improve our customers’ experience in Sheets. Based on your feedback, we’re rolling out more updates today to help teams get work done faster:
- Keyboard shortcuts: Change default shortcuts in your browser to the same spreadsheet shortcuts you’re already used to. For example, delete a row quickly by using “Ctrl+-.”
- Upgraded printing experience: Preview Sheet data in today’s new print interface. Adjust margins, select scale and alignment options or repeat frozen rows and columns before you print your work.
- Powerful new chart editing experience: Create and edit charts in a new, improved sidebar. Choose from custom colors in charts or add additional trendlines to model data. You can also create more chart types, like 3D charts. This is now also available for iPhones and iPads.
- More spreadsheet functions: We added new functions to help you find insights, bringing the total function count in Sheets to more than 400. Try “SORTN,” a function unique to Sheets, which can show you the top three orders or best-performing months in a sales record spreadsheet. Sheets also supports statistical functions like “GAMMADIST,” “F.TEST” and “CHISQ.INV.RT.”
- Increased support for charts in the Sheets API: Use the API to programmatically generate most charts with support for dozens of new operations.
These new features in Sheets are rolling out starting today. Learn how Sheets can help you find valuable insights.
One last thing—so that we can focus our efforts on the improvements to charts outlined above, we’re also deprecating one of the lesser-used chart types: the Motion chart. Beginning in July 2017, you will no longer be able to insert or create Motion charts, and, in September 2017, you will no longer be able to edit them.
No earlier than December 2017, any Motion charts still in Sheets will become static images and no longer update when their corresponding data changes.
We recommend trying Bubble charts instead.
Launch Details
Release track:
- All mobile and API features launching to both Rapid release and Scheduled release on June 1st, 2017
- All web features launching to Rapid release on June 1st, 2017, with Scheduled release coming on June 14th, 2017
Editions:
Available to all G Suite editions
Rollout pace:
Gradual rollout (up to 15 days for feature visibility)
Impact:
All end users
Action:
Change management suggested/FYI
More Information
Help Center: Add a chart or graph to a spreadsheet
Help Center: Chart types
Help Center: Add a chart or table to Google Docs or Slides
Launch release calendar
Launch detail categories
Get these product update alerts by email
Subscribe to the RSS feed of these updates