Posted by Ben Weiss, Senior Developer Relations Engineer and Sara Hamilton, Product Manager
We spent the past week diving deep into sharing best practices and guidance that helps to make Android apps faster, smaller, and more stable. From the foundational powers of the R8 optimizer and Profile Guided Optimizations, to performance improvements with Jetpack Compose, to a new guide on levelling up your app's performance, we've covered the low effort, high impact tools you need to build a performant app.
This post serves as your index and roadmap to revisit these resources whenever you need to optimize. Here are the five key takeaways from our journey together.
Use the R8 optimizer to speed up your app
The single most impactful, low-effort change you can make is fully enabling the R8 optimizer. It doesn't just reduce app size; it performs deep, whole-program optimizations to fundamentally rewrite your code for efficiency. Revisit your Keep Rules and get R8 back into your engineering tasks.
Engineers at Disney+ invest in app performance and are optimizing the app's user experience. Sometimes even seemingly small changes can make a huge impact. While inspecting their R8 configuration, the team found that the -dontoptimize flag was being used. After enabling optimizations by removing this flag, the Disney+ team saw significant improvements in their app's performance.
So next time someone asks you what you could do to improve app performance, just link them to this post.
Baseline Profiles effectively remove the need for Just in Time compilation, improving startup speed, scrolling, animation and overall rendering performance. Startup Profiles make app startup more even more lightweight by bringing an intelligent order to your app's classes.dex files.
And to learn more about just how important Baseline Profiles are for app performance, read Meta's engineering blog where they shared how Baseline Profiles improved various critical performance metrics by up to 40% across their apps.
We continue to make Jetpack Compose more performant for you in Jetpack Compose 1.10. Features like pausable composition and the customizable cache window are crucial for maintaining zero scroll jank when dealing with complex list items.Take a look at the latest episode of #TheAndroidShow where we explain this in more detail.
You can't manage what you don't measure. Our Performance Leveling Guide breaks down your measurement journey into five steps, starting with easily available data and building up to advanced local tooling. Starting at level 1, we’ll teach you how to use readily available data from Android Vitals, which provides you with field data on ANRs, crashes, and excessive battery usage.
We’ll also teach you how to level up. For example, we’ll demonstrate how to reachlevel 3 with local performance testingusing Jetpack Macrobenchmark and the new UiAutomator 2.4 API to accurately measure and verify any change in your app's performance.
Advanced optimization shouldn't mean unreadable crash reports. New features are designed to help you confidently debug R8 and background work:
Automatic Logcat Retrace
Starting in Android Studio Narwhal, stack traces can automatically be de-obfuscated in the Logcat window. This way you can immediately see and debug any crashes in a production-ready build.
Narrow Keep Rules
On Tuesday we demystified the Keep Rules needed to fix runtime crashes, emphasizing writing specific, member-level rules over overly-broad wildcards. And because it's an important topic, we made you a video as well.
And with the new lint check for wide Keep Rules, the Android Studio Otter 3 Feature Drop has you covered here as well.
We also released new guidance on testing and troubleshooting your R8 configuration to help you get the configuration right with confidence.
We shared guidance on debugging common scenarios you may encounter when scheduling tasks with WorkManager.
Background Task Inspector gives you a visual representation and graph view of WorkManager tasks, helping debug why scheduled work is delayed or failed. And our refreshed Background Work documentation landing page highlights task-specific APIs that are optimized for particular use cases, helping you achieve more reliable execution.
If you successfully took our challenge to enable R8 full mode this week, your next step is to integrate performance into your product roadmap using the App Performance Score. This standardized framework helps you find the highest leverage action items for continuous improvement.
We capped off the week with the #AskAndroid Live Q&A session, where engineers answered your toughest questions on R8, Profile Guided Optimizations, and more. If you missed it, look for the replay!
Thank you for joining us! Now, get building and keep that momentum going.
The Dev channel has been updated to 144.0.7534.2/.3 for Windows, 144.0.7534.0 for Mac and Linux.
A partial list of changes is available in the Git log. Interested in switching release channels? Find out how. If you find a new issue, please let us know by filing a bug. The community help forum is also a great place to reach out for help or learn about common issues.
We’re excited to introduce a new way to triage your messages. Now, you can preview the last unread message in conversations directly from the left-hand menu, without marking it as read.
Simply hover over a bolded conversation to peek at the message. When you are ready to engage, click to jump straight into the conversation or thread and take action.
Getting started
Admins: There is no admin control for this feature.
End users: There is no end user setting for this feature. This feature will be ON by default as it rolls out.
Rollout pace
Rapid Release and Scheduled Release domains: Extended rollout (potentially longer than 15 days for feature visibility) starting November 21, 2025, with expected completion by mid-December 2025
Availability
Available to all Google Workspace customers, Workspace Individual Subscribers, and users with personal Google accounts
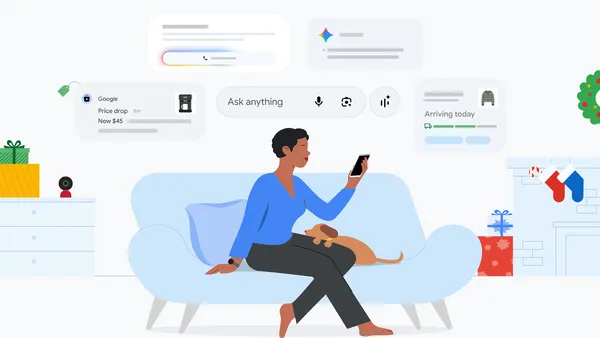 Learn more about ways to use Google tools like Gemini, Google Photos, Search and more to get things done over the holidays.


 Use Gemini, Search, Pixel and more to make holiday planning feel effortless in 2025.

 Learn more about how you can use Google Shopping features — including AI tools — over Black Friday and Cyber Monday.