Tag Archives: Patrik Höglund

Hackable Projects – Pillar 3: Infrastructure

By: Patrik Höglund

This is the third article in our series on Hackability; also see the first and second article.


We have seen in our previous articles how Code Health and Debuggability can make a project much easier to work on. The third pillar is a solid infrastructure that gets accurate feedback to your developers as fast as possible. Speed is going to be major theme in this article, and we’ll look at a number of things you can do to make your project easier to hack on.

Build Systems Speed


Question: What’s a change you’d really like to see in our development tools?

“I feel like this question gets asked almost every time, and I always give the same answer:
 I would like them to be faster.”
        -- Ian Lance Taylor


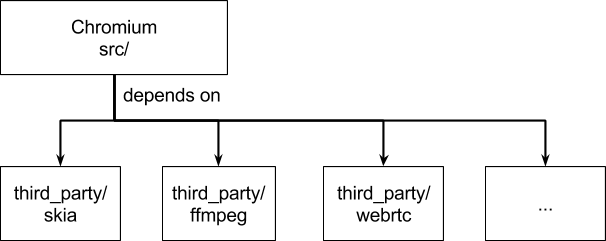
Replace make with ninja. Use the gold linker instead of ld. Detect and delete dead code in your project (perhaps using coverage tools). Reduce the number of dependencies, and enforce dependency rules so new ones are not added lightly. Give the developers faster machines. Use distributed build, which is available with many open-source continuous integration systems (or use Google’s system, Bazel!). You should do everything you can to make the build faster.

Figure 1: “Cheetah chasing its prey” by Marlene Thyssen.


Why is that? There’s a tremendous difference in hackability if it takes 5 seconds to build and test versus one minute, or even 20 minutes, to build and test. Slow feedback cycles kill hackability, for many reasons:
  • Build and test times longer than a handful of seconds cause many developers’ minds to wander, taking them out of the zone.
  • Excessive build or release times* makes tinkering and refactoring much harder. All developers have a threshold when they start hedging (e.g. “I’d like to remove this branch, but I don’t know if I’ll break the iOS build”) which causes refactoring to not happen.

* The worst I ever heard of was an OS that took 24 hours to build!


How do you actually make fast build systems? There are some suggestions in the first paragraph above, but the best general suggestion I can make is to have a few engineers on the project who deeply understand the build systems and have the time to continuously improve them. The main axes of improvement are:
  1. Reduce the amount of code being compiled.
  2. Replace tools with faster counterparts.
  3. Increase processing power, maybe through parallelization or distributed systems.
Note that there is a big difference between full builds and incremental builds. Both should be as fast as possible, but incremental builds are by far the most important to optimize. The way you tackle the two is different. For instance, reducing the total number of source files will make a full build faster, but it may not make an incremental build faster. 

To get faster incremental builds, in general, you need to make each source file as decoupled as possible from the rest of the code base. The less a change ripples through the codebase, the less work to do, right? See “Loose Coupling and Testability” in Pillar 1 for more on this subject. The exact mechanics of dependencies and interfaces depends on programming language - one of the hardest to get right is unsurprisingly C++, where you need to be disciplined with includes and forward declarations to get any kind of incremental build performance. 

Build scripts and makefiles should be held to standards as high as the code itself. Technical debt and unnecessary dependencies have a tendency to accumulate in build scripts, because no one has the time to understand and fix them. Avoid this by addressing the technical debt as you go.

Continuous Integration and Presubmit Queues


You should build and run tests on all platforms you release on. For instance, if you release on all the major desktop platforms, but all your developers are on Linux, this becomes extra important. It’s bad for hackability to update the repo, build on Windows, and find that lots of stuff is broken. It’s even worse if broken changes start to stack on top of each other. I think we all know that terrible feeling: when you’re not sure your change is the one that broke things.

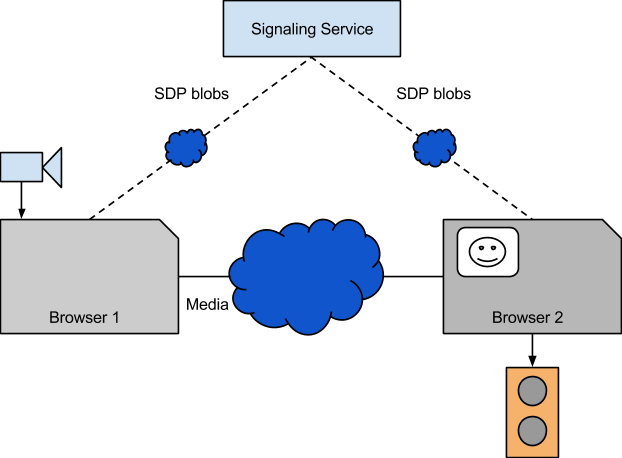
At a minimum, you should build and test on all platforms, but it’s even better if you do it in presubmit. The Chromium submit queue does this. It has developed over the years so that a normal patch builds and tests on about 30 different build configurations before commit. This is necessary for the 400-patches-per-day velocity of the Chrome project. Most projects obviously don’t have to go that far. Chromium’s infrastructure is based off BuildBot, but there are many other job scheduling systems depending on your needs.

Figure 2: How a Chromium patch is tested.

As we discussed in Build Systems, speed and correctness are critical here. It takes a lot of ongoing work to keep build, tests, and presubmits fast and free of flakes. You should never accept flakes, since developers very quickly lose trust in flaky tests and systems. Tooling can help a bit with this; for instance, see the Chromium flakiness dashboard.

Test Speed


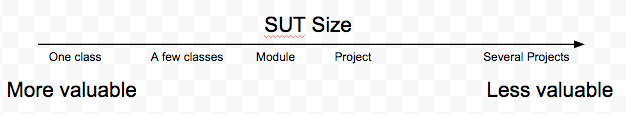
Speed is a feature, and this is particularly true for developer infrastructure. In general, the longer a test takes to execute, the less valuable it is. My rule of thumb is: if it takes more than a minute to execute, its value is greatly diminished. There are of course some exceptions, such as soak tests or certain performance tests. 

Figure 3. Test value.

If you have tests that are slower than 60 seconds, they better be incredibly reliable and easily debuggable. A flaky test that takes several minutes to execute often has negative value because it slows down all work in the code it covers. You probably want to build better integration tests on lower levels instead, so you can make them faster and more reliable.

If you have many engineers on a project, reducing the time to run the tests can have a big impact. This is one reason why it’s great to have SETIs or the equivalent. There are many things you can do to improve test speed:
  • Sharding and parallelization. Add more machines to your continuous build as your test set or number of developers grows.
  • Continuously measure how long it takes to run one build+test cycle in your continuous build, and have someone take action when it gets slower.
  • Remove tests that don’t pull their weight. If a test is really slow, it’s often because of poorly written wait conditions or because the test bites off more than it can chew (maybe that unit test doesn’t have to process 15000 audio frames, maybe 50 is enough).
  • If you have tests that bring up a local server stack, for instance inter-server integration tests, making your servers boot faster is going to make the tests faster as well. Faster production code is faster to test! See Running on Localhost, in Pillar 2 for more on local server stacks.

Workflow Speed


We’ve talked about fast builds and tests, but the core developer workflows are also important, of course. Chromium undertook multi-year project to switch from Subversion to Git, partly because Subversion was becoming too slow. You need to keep track of your core workflows as your project grows. Your version control system may work fine for years, but become too slow once the project becomes big enough. Bug search and management must also be robust and fast, since this is generally systems developers touch every day.

Release Often


It aids hackability to deploy to real users as fast as possible. No matter how good your product's tests are, there's always a risk that there's something you haven't thought of. If you’re building a service or web site, you should aim to deploy multiple times per week. For client projects, Chrome’s six-weeks cycle is a good goal to aim for.

You should invest in infrastructure and tests that give you the confidence to do this - you don’t want to push something that’s broken. Your developers will thank you for it, since it makes their jobs so much easier. By releasing often, you mitigate risk, and developers will rush less to hack late changes in the release (since they know the next release isn’t far off).

Easy Reverts


If you look in the commit log for the Chromium project, you will see that a significant percentage of the commits are reverts of a previous commits. In Chromium, bad commits quickly become costly because they impede other engineers, and the high velocity can cause good changes to stack onto bad changes. 

Figure 4: Chromium’s revert button.


This is why the policy is “revert first, ask questions later”. I believe a revert-first policy is good for small projects as well, since it creates a clear expectation that the product/tools/dev environment should be working at all times (and if it doesn’t, a recent change should probably be reverted).

It has a wonderful effect when a revert is simple to make. You can suddenly make speculative reverts if a test went flaky or a performance test regressed. It follows that if a patch is easy to revert, so is the inverse (i.e. reverting the revert or relanding the patch). So if you were wrong and that patch wasn’t guilty after all, it’s simple to re-land it again and try reverting another patch. Developers might initially balk at this (because it can’t possibly be their patch, right?), but they usually come around when they realize the benefits.

For many projects, a revert can simply be
git revert 9fbadbeef
git push origin master


If your project (wisely) involves code review, it will behoove you to add something like Chromium’s revert button that I mentioned above. The revert button will create a special patch that bypasses review and tests (since we can assume a clean revert takes us back to a more stable state rather than the opposite). See Pillar 1 for more on code review and its benefits.

For some projects, reverts are going to be harder, especially if you have a slow or laborious release process. Even if you release often, you could still have problems if a revert involves state migrations in your live services (for instance when rolling back a database schema change). You need to have a strategy to deal with such state changes. 


Reverts must always put you back to safer ground, and everyone must be confident they can safely revert. If not, you run the risk of massive fire drills and lost user trust if a bad patch makes it through the tests and you can’t revert it.

Performance Tests: Measure Everything


Is it critical that your app starts up within a second? Should your app always render at 60 fps when it’s scrolled up or down? Should your web server always serve a response within 100 ms? Should your mobile app be smaller than 8 MB? If so, you should make a performance test for that. Performance tests aid hackability since developers can quickly see how their change affects performance and thus prevent performance regressions from making it into the wild.

You should run your automated performance tests on the same device; all devices are different and this will reflect in the numbers. This is fairly straightforward if you have a decent continuous integration system that runs tests sequentially on a known set of worker machines. It’s harder if you need to run on physical phones or tablets, but it can be done. 

A test can be as simple as invoking a particular algorithm and measuring the time it takes to execute it (median and 90th percentile, say, over N runs).

Figure 5: A VP8-in-WebRTC regression (bug) and its fix displayed in a Catapult dashboard.


Write your test so it outputs performance numbers you care about. But what to do with those numbers? Fortunately, Chrome’s performance test framework has been open-sourced, which means you can set up a dashboard, with automatic regression monitoring, with minimal effort. The test framework also includes the powerful Telemetry framework which can run actions on web pages and Android apps and report performance results. Telemetry and Catapult are battle-tested by use in the Chromium project and are capable of running on a wide set of devices, while getting the maximum of usable performance data out of the devices.

Sources


Figure 1: By Malene Thyssen (Own work) [CC BY-SA 3.0 (http://creativecommons.org/licenses/by-sa/3.0)], via Wikimedia Commons


Hackable Projects – Pillar 2: Debuggability

By: Patrik Höglund

This is the second article in our series on Hackability; also see the first article.


“Deep into that darkness peering, long I stood there, wondering, fearing, doubting, dreaming dreams no mortal ever dared to dream before.” -- Edgar Allan Poe


Debuggability can mean being able to use a debugger, but here we’re interested in a broader meaning. Debuggability means being able to easily find what’s wrong with a piece of software, whether it’s through logs, statistics or debugger tools. Debuggability doesn’t happen by accident: you need to design it into your product. The amount of work it takes will vary depending on your product, programming language(s) and development environment.

In this article, I am going to walk through a few examples of how we have aided debuggability for our developers. If you do the same analysis and implementation for your project, perhaps you can help your developers illuminate the dark corners of the codebase and learn what truly goes on there.
Figure 1: computer log entry from the Mark II, with a moth taped to the page.

Running on Localhost

Read more on the Testing Blog: Hermetic Servers by Chaitali Narla and Diego Salas


Suppose you’re developing a service with a mobile app that connects to that service. You’re working on a new feature in the app that requires changes in the backend. Do you develop in production? That’s a really bad idea, as you must push unfinished code to production to work on your change. Don’t do that: it could break your service for your existing users. Instead, you need some kind of script that brings up your server stack on localhost.

You can probably run your servers by hand, but that quickly gets tedious. In Google, we usually use fancy python scripts that invoke the server binaries with flags. Why do we need those flags? Suppose, for instance, that you have a server A that depends on a server B and C. The default behavior when the server boots should be to connect to B and C in production. When booting on localhost, we want to connect to our local B and C though. For instance:

b_serv --port=1234 --db=/tmp/fakedb
c_serv --port=1235
a_serv --b_spec=localhost:1234 --c_spec=localhost:1235

That makes it a whole lot easier to develop and debug your server. Make sure the logs and stdout/stderr end up in some well-defined directory on localhost so you don’t waste time looking for them. You may want to write a basic debug client that sends HTTP requests or RPCs or whatever your server handles. It’s painful to have to boot the real app on a mobile phone just to test something.

A localhost setup is also a prerequisite for making hermetic tests,where the test invokes the above script to bring up the server stack. The test can then run, say, integration tests among the servers or even client-server integration tests. Such integration tests can catch protocol drift bugs between client and server, while being super stable by not talking to external or shared services.

Debugging Mobile Apps

First, mobile is hard. The tooling is generally less mature than for desktop, although things are steadily improving. Again, unit tests are great for hackability here. It’s really painful to always load your app on a phone connected to your workstation to see if a change worked. Robolectric unit tests and Espresso functional tests, for instance, run on your workstation and do not require a real phone. xcTestsand Earl Grey give you the same on iOS.

Debuggers ship with Xcode and Android Studio. If your Android app ships JNI code, it’s a bit trickier, but you can attach GDB to running processes on your phone. It’s worth spending the time figuring this out early in the project, so you don’t have to guess what your code is doing. Debugging unit tests is even better and can be done straightforwardly on your workstation.

When Debugging gets Tricky

Some products are harder to debug than others. One example is hard real-time systems, since their behavior is so dependent on timing (and you better not be hooked up to a real industrial controller or rocket engine when you hit a breakpoint!). One possible solution is to run the software on a fake clock instead of a hardware clock, so the clock stops when the program stops.

Another example is multi-process sandboxed programs such as Chromium. Since the browser spawns one renderer process per tab, how do you even attach a debugger to it? The developers have made it quite a lot easier with debugging flags and instructions. For instance, this wraps gdb around each renderer process as it starts up:

chrome --renderer-cmd-prefix='xterm -title renderer -e gdb --args'

The point is, you need to build these kinds of things into your product; this greatly aids hackability.

Proper Logging

Read more on the Testing Blog: Optimal Logging by Anthony Vallone


It’s hackability to get the right logs when you need them. It’s easy to fix a crash if you get a stack trace from the error location. It’s far from guaranteed you’ll get such a stack trace, for instance in C++ programs, but this is something you should not stand for. For instance, Chromium had a problem where renderer process crashes didn’t print in test logs, because the test was running in a separate process. This was later fixed, and this kind of investment is worthwhile to make. A clean stack trace is worth a lot more than a “renderer crashed” message.

Logs are also useful for development. It’s an art to determine how much logging is appropriate for a given piece of code, but it is a good idea to keep the default level of logging conservative and give developers the option to turn on more logging for the parts they’re working on (example: Chromium). Too much logging isn’t hackability. This article elaborates further on this topic.

Logs should also be properly symbolized for C/C++ projects; a naked list of addresses in a stack trace isn’t very helpful. This is easy if you build for development (e.g. with -g), but if the crash happens in a release build it’s a bit trickier. You then need to build the same binary with the same flags and use addr2line / ndk-stack / etc to symbolize the stack trace. It’s a good idea to build tools and scripts for this so it’s as easy as possible.

Monitoring and Statistics

It aids hackability if developers can quickly understand what effect their changes have in the real world. For this, monitoring tools such as Stackdriver for Google Cloudare excellent. If you’re running a service, such tools can help you keep track of request volumes and error rates. This way you can quickly detect that 30% increase in request errors, and roll back that bad code change, before it does too much damage. It also makes it possible to debug your service in production without disrupting it.

System Under Test (SUT) Size

Tests and debugging go hand in hand: it’s a lot easier to target a piece of code in a test than in the whole application. Small and focused tests aid debuggability, because when a test breaks there isn’t an enormous SUT to look for errors in. These tests will also be less flaky. This article discusses this fact at length.


Figure 2. The smaller the SUT, the more valuable the test.

You should try to keep the above in mind, particularly when writing integration tests. If you’re testing a mobile app with a server, what bugs are you actually trying to catch? If you’re trying to ensure the app can still talk to the server (i.e. catching protocol drift bugs), you should not involve the UI of the app. That’s not what you’re testing here. Instead, break out the signaling part of the app into a library, test that directly against your local server stack, and write separate tests for the UI that only test the UI.

Smaller SUTs also greatly aids test speed, since there’s less to build, less to bring up and less to keep running. In general, strive to keep the SUT as small as possible through whatever means necessary. It will keep the tests smaller, faster and more focused.

Sources

Figure 1: By Courtesy of the Naval Surface Warfare Center, Dahlgren, VA., 1988. - U.S. Naval Historical Center Online Library Photograph NH 96566-KN, Public Domain, https://commons.wikimedia.org/w/index.php?curid=165211

Hackable Projects

By: Patrik Höglund

Introduction

Software development is difficult. Projects often evolve over several years, under changing requirements and shifting market conditions, impacting developer tools and infrastructure. Technical debt, slow build systems, poor debuggability, and increasing numbers of dependencies can weigh down a project The developers get weary, and cobwebs accumulate in dusty corners of the code base.

Fighting these issues can be taxing and feel like a quixotic undertaking, but don’t worry — the Google Testing Blog is riding to the rescue! This is the first article of a series on “hackability” that identifies some of the issues that hinder software projects and outlines what Google SETIs usually do about them.

According to Wiktionary, hackable is defined as:
Adjective
hackable ‎(comparative more hackable, superlative most hackable)
  1. (computing) That can be hacked or broken into; insecure, vulnerable. 
  2. That lends itself to hacking (technical tinkering and modification); moddable.

Obviously, we’re not going to talk about making your product more vulnerable (by, say, rolling your own crypto or something equally unwise); instead, we will focus on the second definition, which essentially means “something that is easy to work on.” This has become the mainfocus for SETIs at Google as the role has evolved over the years.

In Practice

In a hackable project, it’s easy to try things and hard to break things. Hackability means fast feedback cycles that offer useful information to the developer.

This is hackability:
  • Developing is easy
  • Fast build
  • Good, fast tests
  • Clean code
  • Easy running + debugging
  • One-click rollbacks
In contrast, what is not hackability?
  • Broken HEAD (tip-of-tree)
  • Slow presubmit (i.e. checks running before submit)
  • Builds take hours
  • Incremental build/link > 30s
  • Flakytests
  • Can’t attach debugger
  • Logs full of uninteresting information

The Three Pillars of Hackability

There are a number of tools and practices that foster hackability. When everything is in place, it feels great to work on the product. Basically no time is spent on figuring out why things are broken, and all time is spent on what matters, which is understanding and working with the code. I believe there are three main pillars that support hackability. If one of them is absent, hackability will suffer. They are:


Pillar 1: Code Health

“I found Rome a city of bricks, and left it a city of marble.”
   -- Augustus

Keeping the code in good shape is critical for hackability. It’s a lot harder to tinker and modify something if you don’t understand what it does (or if it’s full of hidden traps, for that matter).

Tests

Unit and small integration tests are probably the best things you can do for hackability. They’re a support you can lean on while making your changes, and they contain lots of good information on what the code does. It isn’t hackability to boot a slow UI and click buttons on every iteration to verify your change worked - it is hackability to run a sub-second set of unit tests! In contrast, end-to-end (E2E) tests generally help hackability much less (and can evenbe a hindrance if they, or the product, are in sufficiently bad shape).

Figure 1: the Testing Pyramid.

I’ve always been interested in how you actually make unit tests happen in a team. It’s about education. Writing a product such that it has good unit tests is actually a hard problem. It requires knowledge of dependency injection, testing/mocking frameworks, language idioms and refactoring. The difficulty varies by language as well. Writing unit tests in Go or Java is quite easy and natural, whereas in C++ it can be very difficult (and it isn’t exactly ingrained in C++ culture to write unit tests).

It’s important to educate your developers about unit tests. Sometimes, it is appropriate to lead by example and help review unit tests as well. You can have a large impact on a project by establishing a pattern of unit testing early. If tons of code gets written without unit tests, it will be much harder to add unit tests later.

What if you already have tons of poorly tested legacy code? The answer is refactoring and adding tests as you go. It’s hard work, but each line you add a test for is one more line that is easier to hack on.

Readable Code and Code Review

At Google, “readability” is a special committer status that is granted per language (C++, Go, Java and so on). It means that a person not only knows the language and its culture and idioms well, but also can write clean, well tested and well structured code. Readability literally means that you’re a guardian of Google’s code base and should push back on hacky and ugly code. The use of a style guide enforces consistency, and code review (where at least one person with readability must approve) ensures the code upholds high quality. Engineers must take care to not depend too much on “review buddies” here but really make sure to pull in the person that can give the best feedback.

Requiring code reviews naturally results in small changes, as reviewers often get grumpy if you dump huge changelists in their lap (at least if reviewers are somewhat fast to respond, which they should be). This is a good thing, since small changes are less risky and are easy to roll back. Furthermore, code review is good for knowledge sharing. You can also do pair programming if your team prefers that (a pair-programmed change is considered reviewed and can be submitted when both engineers are happy). There are multiple open-source review tools out there, such as Gerrit.

Nice, clean code is great for hackability, since you don’t need to spend time to unwind that nasty pointer hack in your head before making your changes. How do you make all this happen in practice? Put together workshops on, say, the SOLID principles, unit testing, or concurrency to encourage developers to learn. Spread knowledge through code review, pair programming and mentoring (such as with the Readability concept). You can’t just mandate higher code quality; it takes a lot of work, effort and consistency.

Presubmit Testing and Lint

Consistently formatted source code aids hackability. You can scan code faster if its formatting is consistent. Automated tooling also aids hackability. It really doesn’t make sense to waste any time on formatting source code by hand. You should be using tools like gofmt, clang-format, etc. If the patch isn’t formatted properly, you should see something like this (example from Chrome):

$ git cl upload
Error: the media/audio directory requires formatting. Please run
git cl format media/audio.

Source formatting isn’t the only thing to check. In fact, you should check pretty much anything you have as a rule in your project. Should other modules not depend on the internals of your modules? Enforce it with a check. Are there already inappropriate dependencies in your project? Whitelist the existing ones for now, but at least block new bad dependencies from forming. Should our app work on Android 16 phones and newer? Add linting, so we don’t use level 17+ APIs without gating at runtime. Should your project’s VHDL code always place-and-route cleanly on a particular brand of FPGA? Invoke the layout tool in your presubmit and and stop submit if the layout process fails.

Presubmit is the most valuable real estate for aiding hackability. You have limited space in your presubmit, but you can get tremendous value out of it if you put the right things there. You should stop all obvious errors here.

It aids hackability to have all this tooling so you don’t have to waste time going back and breaking things for other developers. Remember you need to maintain the presubmit well; it’s not hackability to have a slow, overbearing or buggy presubmit. Having a good presubmit can make it tremendously more pleasant to work on a project. We’re going to talk more in later articles on how to build infrastructure for submit queues and presubmit.

Single Branch And Reducing Risk

Having a single branch for everything, and putting risky new changes behind feature flags, aids hackability since branches and forks often amass tremendous risk when it’s time to merge them. Single branches smooth out the risk. Furthermore, running all your tests on many branches is expensive. However, a single branch can have negative effects on hackability if Team A depends on a library from Team B and gets broken by Team B a lot. Having some kind of stabilization on Team B’s software might be a good idea there. Thisarticle covers such situations, and how to integrate often with your dependencies to reduce the risk that one of them will break you.

Loose Coupling and Testability

Tightly coupled code is terrible for hackability. To take the most ridiculous example I know: I once heard of a computer game where a developer changed a ballistics algorithm and broke the game’s chat. That’s hilarious, but hardly intuitive for the poor developer that made the change. A hallmark of loosely coupled code is that it’s upfront about its dependencies and behavior and is easy to modify and move around.

Loose coupling, coherence and so on is really about design and architecture and is notoriously hard to measure. It really takes experience. One of the best ways to convey such experience is through code review, which we’ve already mentioned. Education on the SOLID principles, rules of thumb such as tell-don’t-ask, discussions about anti-patterns and code smells are all good here. Again, it’s hard to build tooling for this. You could write a presubmit check that forbids methods longer than 20 lines or cyclomatic complexity over 30, but that’s probably shooting yourself in the foot. Developers would consider that overbearing rather than a helpful assist.

SETIs at Google are expected to give input on a product’s testability. A few well-placed test hooks in your product can enable tremendously powerful testing, such as serving mock content for apps (this enables you to meaningfully test app UI without contacting your real servers, for instance). Testability can also have an influence on architecture. For instance, it’s a testability problem if your servers are built like a huge monolith that is slow to build and start, or if it can’t boot on localhost without calling external services. We’ll cover this in the next article.

Aggressively Reduce Technical Debt

It’s quite easy to add a lot of code and dependencies and call it a day when the software works. New projects can do this without many problems, but as the project becomes older it becomes a “legacy” project, weighed down by dependencies and excess code. Don’t end up there. It’s bad for hackability to have a slew of bug fixes stacked on top of unwise and obsolete decisions, and understanding and untangling the software becomes more difficult.

What constitutes technical debt varies by project and is something you need to learn from experience. It simply means the software isn’t in optimal form. Some types of technical debt are easy to classify, such as dead code and barely-used dependencies. Some types are harder to identify, such as when the architecture of the project has grown unfit to the task from changing requirements. We can’t use tooling to help with the latter, but we can with the former.

I already mentioned that dependency enforcement can go a long way toward keeping people honest. It helps make sure people are making the appropriate trade-offs instead of just slapping on a new dependency, and it requires them to explain to a fellow engineer when they want to override a dependency rule. This can prevent unhealthy dependencies like circular dependencies, abstract modules depending on concrete modules, or modules depending on the internals of other modules.

There are various tools available for visualizing dependency graphs as well. You can use these to get a grip on your current situation and start cleaning up dependencies. If you have a huge dependency you only use a small part of, maybe you can replace it with something simpler. If an old part of your app has inappropriate dependencies and other problems, maybe it’s time to rewrite that part.

The next article will be on Pillar 2: Debuggability.

Audio Testing – Automatic Gain Control

By: Patrik Höglund

What is Automatic Gain Control? 

It’s time to talk about advanced media quality tests again! As experienced Google testing blog readers know, when I write an article it’s usually about WebRTC, and the unusual testing solutions we build to test it. This article is no exception. Today we’re going to talk about Automatic Gain Control, or AGC. This is a feature that’s on by default for WebRTC applications, such as http://apprtc.appspot.com. It uses various means to adjust the microphone signal so your voice makes it loud and clear to the other side of the peer connection. For instance, it can attempt to adjust your microphone gain or try to amplify the signal digitally.

Figure 1. How Auto Gain Control works [code here].

This is an example of automatic control engineering (another example would be the classic PID controller) and happens in real time. Therefore, if you move closer to the mic while speaking, the AGC will notice the output stream is too loud, and reduce mic volume and/or digital gain. When you move further away, it tries to adapt up again. The fancy voice activity detector is there so we only amplify speech, and not, say, the microwave oven your spouse just started in the other room.

Testing the AGC

Now, how do we make sure the AGC works? The first thing is obviously to write unit tests and integration tests. You didn’t think about building that end-to-end test first, did you? Once we have the lower-level tests in place, we can start looking at a bigger test. While developing the WebRTC implementation in Chrome, we had several bugs where the AGC code was working by itself, but was misconfigured in Chrome. In one case, it was simply turned off for all users. In another, it was only turned off in Hangouts.

Only an end-to-end test can catch these integration issues, and we already had stable, low-maintenance audio quality tests with the ability to record Chrome’s output sound for analysis. I encourage you to read that article, but the bottom line is that those tests can run a WebRTC call in two tabs and record the audio output to a file. Those tests run the PESQ algorithm on input and output to see how similar they are.

That’s a good framework to have, but I needed to make two changes:

  • Add file support to Chrome’s fake audio input device, so we can play a known file. The original audio test avoided this by using WebAudio, but AGC doesn’t run in the WebAudio path, just the microphone capture path, so that won’t work.
  • Instead of running PESQ, run an analysis that compares the gain between input and output.

Adding Fake File Support

This is always a big part of the work in media testing: controlling the input and output. It’s unworkable to tape microphones to loudspeakers or point cameras to screens to capture the media, so the easiest solution is usually to add a debug flag. It is exactly what I did here. It was a lot of work, but I won’t go into much detail since Chrome’s audio pipeline is complex. The core is this:

int FileSource::OnMoreData(AudioBus* audio_bus, uint32 total_bytes_delay) {
// Load the file if we haven't already. This load needs to happen on the
// audio thread, otherwise we'll run on the UI thread on Mac for instance.
// This will massively delay the first OnMoreData, but we'll catch up.
if (!wav_audio_handler_)
LoadWavFile(path_to_wav_file_);
if (load_failed_)
return 0;

DCHECK(wav_audio_handler_.get());

// Stop playing if we've played out the whole file.
if (wav_audio_handler_->AtEnd(wav_file_read_pos_))
return 0;

// This pulls data from ProvideInput.
file_audio_converter_->Convert(audio_bus);
return audio_bus->frames();
}

This code runs every 10 ms and reads a small chunk from the file, converts it to Chrome’s preferred audio format and sends it on through the audio pipeline. After implementing this, I could simply run:

chrome --use-fake-device-for-media-stream 
--use-file-for-fake-audio-capture=/tmp/file.wav

and whenever I hit a webpage that used WebRTC, the above file would play instead of my microphone input. Sweet!

The Analysis Stage

Next I had to get the analysis stage figured out. It turned out there was something called an AudioPowerMonitor in the Chrome code, which you feed audio data into and get the average audio power for the data you fed in. This is a measure of how “loud” the audio is. Since the whole point of the AGC is getting to the right audio power level, we’re looking to compute

Adiff = Aout - Ain

Or, really, how much louder or weaker is the output compared to the input audio? Then we can construct different scenarios: Adiff should be 0 if the AGC is turned off and it should be > 0 dB if the AGC is on and we feed in a low power audio file. Computing the average energy of an audio file was straightforward to implement:

  // ...
size_t bytes_written;
wav_audio_handler->CopyTo(audio_bus.get(), 0, &bytes_written);
CHECK_EQ(bytes_written, wav_audio_handler->data().size())
<< "Expected to write entire file into bus.";

// Set the filter coefficient to the whole file's duration; this will make
// the power monitor take the entire file into account.
media::AudioPowerMonitor power_monitor(wav_audio_handler->sample_rate(),
file_duration);
power_monitor.Scan(*audio_bus, audio_bus->frames());
// ...
return power_monitor.ReadCurrentPowerAndClip().first;

I wrote a new test, and hooked up the above logic instead of PESQ. I could compute Ain by running the above algorithm on the reference file (which I fed in using the flag I implemented above) and Aout on the recording of the output audio. At this point I pretty much thought I was done. I ran a WebRTC call with the AGC turned off, expecting to get zero… and got a huge number. Turns out I wasn’t done.

What Went Wrong?

I needed more debugging information to figure out what went wrong. Since the AGC was off, I would expect the power curves for output and input to be identical. All I had was the average audio power over the entire file, so I started plotting the audio power for each 10 millisecond segment instead to understand where the curves diverged. I could then plot the detected audio power over the time of the test. I started by plotting Adiff :

Figure 2. Plot of Adiff.

The difference is quite small in the beginning, but grows in amplitude over time. Interesting. I then plotted Aout and Ain next to each other:

Figure 3. Plot of Aout and Ain.

A-ha! The curves drift apart over time; the above shows about 10 seconds of time, and the drift is maybe 80 ms at the end. The more they drift apart, the bigger the diff becomes. Exasperated, I asked our audio engineers about the above. Had my fancy test found its first bug? No, as it turns out - it was by design.

Clock Drift and Packet Loss

Let me explain. As a part of WebRTC audio processing, we run a complex module called NetEq on the received audio stream. When sending audio over the Internet, there will inevitably be packet loss and clock drift. Packet losses always happen on the Internet, depending on the network path between sender and receiver. Clock drift happens because the sample clocks on the sending and receiving sound cards are not perfectly synced.

In this particular case, the problem was not packet loss since we have ideal network conditions (one machine, packets go over the machine’s loopback interface = zero packet loss). But how can we have clock drift? Well, recall the fake device I wrote earlier that reads a file? It never touches the sound card like when the sound comes from the mic, so it runs on the system clock. That clock will drift against the machine’s sound card clock, even when we are on the same machine.

NetEq uses clever algorithms to conceal clock drift and packet loss. Most commonly it applies time compression or stretching on the audio it plays out, which means it makes the audio a little shorter or longer when needed to compensate for the drift. We humans mostly don’t even notice that, whereas a drift left uncompensated would result in a depleted or flooded receiver buffer – very noticeable. Anyway, I digress. This drift of the recording vs. the reference file was natural and I would just have to deal with it.

Silence Splitting to the Rescue!

I could probably have solved this with math and postprocessing of the results (least squares maybe?), but I had another idea. The reference file happened to be comprised of five segments with small pauses between them. What if I made these pauses longer, split the files on the pauses and trimmed away all the silence? This would effectively align the start of each segment with its corresponding segment in the reference file.

Figure 4. Before silence splitting.

Figure 5. After silence splitting.

We would still have NetEQ drift, but as you can see its effects will not stack up towards the end, so if the segments are short enough we should be able to mitigate this problem.

Result

Here is the final test implementation:

  base::FilePath reference_file = 
test::GetReferenceFilesDir().Append(reference_filename);
base::FilePath recording = CreateTemporaryWaveFile();

ASSERT_NO_FATAL_FAILURE(SetupAndRecordAudioCall(
reference_file, recording, constraints,
base::TimeDelta::FromSeconds(30)));

base::ScopedTempDir split_ref_files;
ASSERT_TRUE(split_ref_files.CreateUniqueTempDir());
ASSERT_NO_FATAL_FAILURE(
SplitFileOnSilenceIntoDir(reference_file, split_ref_files.path()));
std::vector<base::FilePath> ref_segments =
ListWavFilesInDir(split_ref_files.path());

base::ScopedTempDir split_actual_files;
ASSERT_TRUE(split_actual_files.CreateUniqueTempDir());
ASSERT_NO_FATAL_FAILURE(
SplitFileOnSilenceIntoDir(recording, split_actual_files.path()));

// Keep the recording and split files if the analysis fails.
base::FilePath actual_files_dir = split_actual_files.Take();
std::vector<base::FilePath> actual_segments =
ListWavFilesInDir(actual_files_dir);

AnalyzeSegmentsAndPrintResult(
ref_segments, actual_segments, reference_file, perf_modifier);

DeleteFileUnlessTestFailed(recording, false);
DeleteFileUnlessTestFailed(actual_files_dir, true);

Where AnalyzeSegmentsAndPrintResult looks like this:

void AnalyzeSegmentsAndPrintResult(
const std::vector<base::FilePath>& ref_segments,
const std::vector<base::FilePath>& actual_segments,
const base::FilePath& reference_file,
const std::string& perf_modifier) {
ASSERT_GT(ref_segments.size(), 0u)
<< "Failed to split reference file on silence; sox is likely broken.";
ASSERT_EQ(ref_segments.size(), actual_segments.size())
<< "The recording did not result in the same number of audio segments "
<< "after on splitting on silence; WebRTC must have deformed the audio "
<< "too much.";

for (size_t i = 0; i < ref_segments.size(); i++) {
float difference_in_decibel = AnalyzeOneSegment(ref_segments[i],
actual_segments[i],
i);
std::string trace_name = MakeTraceName(reference_file, i);
perf_test::PrintResult("agc_energy_diff", perf_modifier, trace_name,
difference_in_decibel, "dB", false);
}
}

The results look like this:

Figure 6. Average Adiff values for each segment on the y axis, Chromium revisions on the x axis.

We can clearly see the AGC applies about 6 dB of gain to the (relatively low-energy) audio file we feed in. The maximum amount of gain the digital AGC can apply is 12 dB, and 7 dB is the default, so in this case the AGC is pretty happy with the level of the input audio. If we run with the AGC turned off, we get the expected 0 dB of gain. The diff varies a bit per segment, since the segments are different in audio power.

Using this test, we can detect if the AGC accidentally gets turned off or malfunctions on windows, mac or linux. If that happens, the with_agc graph will drop from ~6 db to 0, and we’ll know something is up. Same thing if the amount of digital gain changes.

A more advanced version of this test would also look at the mic level the AGC sets. This mic level is currently ignored in the test, but it could take it into account by artificially amplifying the reference file when played through the fake device. We could also try throwing curveballs at the AGC, like abruptly raising the volume mid-test (as if the user leaned closer to the mic), and look at the gain for the segments to ensure it adapted correctly.

Multi-Repository Development

Author: Patrik Höglund

As we all know, software development is a complicated activity where we develop features and applications to provide value to our users. Furthermore, any nontrivial modern software is composed out of other software. For instance, the Chrome web browser pulls roughly a hundred libraries into its third_party folder when you build the browser. The most significant of these libraries is Blink, the rendering engine, but there’s also ffmpeg for image processing, skia for low-level 2D graphics, and WebRTC for real-time communication (to name a few).

Figure 1. Holy dependencies, Batman!

There are many reasons to use software libraries. Why write your own phone number parser when you can use libphonenumber, which is battle-tested by real use in Android and Chrome and available under a permissive license? Using such software frees you up to focus on the core of your software so you can deliver a unique experience to your users. On the other hand, you need to keep your application up to date with changes in the library (you want that latest bug fix, right?), and you also run a risk of such a change breaking your application. This article will examine that integration problem and how you can reduce the risks associated with it.

Updating Dependencies is Hard

The simplest solution is to check in a copy of the library, build with it, and avoid touching it as much as possible. This solution, however, can be problematic because you miss out on bug fixes and new features in the library. What if you need a new feature or bug fix that just made it in? You have a few options:
  • Update the library to its latest release. If it’s been a long time since you did this, it can be quite risky and you may have to spend significant testing resources to ensure all the accumulated changes don’t break your application. You may have to catch up to interface changes in the library as well. 
  • Cherry-pick the feature/bug fix you want into your copy of the library. This is even riskier because your cherry-picked patches may depend on other changes in the library in subtle ways. Also, you still are not up to date with the latest version. 
  • Find some way to make do without the feature or bug fix.
None of the above options are very good. Using this ad-hoc updating model can work if there’s a low volume of changes in the library and our requirements on the library don’t change very often. Even if that is the case, what will you do if a critical zero-day exploit is discovered in your socket library?

One way to mitigate the update risk is to integrate more often with your dependencies. As an extreme example, let’s look at Chrome.

In Chrome development, there’s a massive amount of change going into its dependencies. The Blink rendering engine lives in a separate code repository from the browser. Blink sees hundreds of code changes per day, and Chrome must integrate with Blink often since it’s an important part of the browser. Another example is the WebRTC implementation, where a large part of Chrome’s implementation resides in the webrtc.org repository. This article will focus on the latter because it’s the team I happen to work on.

How “Rolling” Works 

The open-sourced WebRTC codebase is used by Chrome but also by a number of other companies working on WebRTC. Chrome uses a toolchain called depot_tools to manage dependencies, and there’s a checked-in text file called DEPS where dependencies are managed. It looks roughly like this:
{
# ...
'src/third_party/webrtc':
'https://chromium.googlesource.com/' +
'external/webrtc/trunk/webrtc.git' +
'@' + '5727038f572c517204e1642b8bc69b25381c4e9f',
}

The above means we should pull WebRTC from the specified git repository at the 572703... hash, similar to other dependency-provisioning frameworks. To build Chrome with a new version, we change the hash and check in a new version of the DEPS file. If the library’s API has changed, we must update Chrome to use the new API in the same patch. This process is known as rolling WebRTC to a new version.

Now the problem is that we have changed the code going into Chrome. Maybe getUserMedia has started crashing on Android, or maybe the browser no longer boots on Windows. We don’t know until we have built and run all the tests. Therefore a roll patch is subject to the same presubmit checks as any Chrome patch (i.e. many tests, on all platforms we ship on). However, roll patches can be considerably more painful and risky than other patches.


Figure 2. Life of a Roll Patch.

On the WebRTC team we found ourselves in an uncomfortable position a couple years back. Developers would make changes to the webrtc.org code and there was a fair amount of churn in the interface, which meant we would have to update Chrome to adapt to those changes. Also we frequently broke tests and WebRTC functionality in Chrome because semantic changes had unexpected consequences in Chrome. Since rolls were so risky and painful to make, they started to happen less often, which made things even worse. There could be two weeks between rolls, which meant Chrome was hit by a large number of changes in one patch.

Bots That Can See the Future: “FYI Bots” 

We found a way to mitigate this which we called FYI (for your information) bots. A bot is Chrome lingo for a continuous build machine which builds Chrome and runs tests.

All the existing Chrome bots at that point would build Chrome as specified in the DEPS file, which meant they would build the WebRTC version we had rolled to up to that point. FYI bots replace that pinned version with WebRTC HEAD, but otherwise build and run Chrome-level tests as usual. Therefore:

  • If all the FYI bots were green, we knew a roll most likely would go smoothly. 
  • If the bots didn’t compile, we knew we would have to adapt Chrome to an interface change in the next roll patch. 
  • If the bots were red, we knew we either had a bug in WebRTC or that Chrome would have to be adapted to some semantic change in WebRTC.
The FYI “waterfall” (a set of bots that builds and runs tests) is a straight copy of the main waterfall, which is expensive in resources. We could have cheated and just set up FYI bots for one platform (say, Linux), but the most expensive regressions are platform-specific, so we reckoned the extra machines and maintenance were worth it.

Making Gradual Interface Changes 

This solution helped but wasn’t quite satisfactory. We initially had the policy that it was fine to break the FYI bots since we could not update Chrome to use a new interface until the new interface had actually been rolled into Chrome. This, however, often caused the FYI bots to be compile-broken for days. We quickly started to suffer from red blindness [1] and had no idea if we would break tests on the roll, especially if an interface change was made early in the roll cycle.

The solution was to move to a more careful update policy for the WebRTC API. For the more technically inclined, “careful” here means “following the API prime directive[2]. Consider this example:
class WebRtcAmplifier {
...
int SetOutputVolume(float volume);
}

Normally we would just change the method’s signature when we needed to:
class WebRtcAmplifier {
...
int SetOutputVolume(float volume, bool allow_eleven1);
}

… but this would compile-break Chome until it could be updated. So we started doing it like this instead:
class WebRtcAmplifier {
...
int SetOutputVolume(float volume);
int SetOutputVolume2(float volume, bool allow_eleven);
}

Then we could:
  1. Roll into Chrome 
  2. Make Chrome use SetOutputVolume2 
  3. Update SetOutputVolume’s signature 
  4. Roll again and make Chrome use SetOutputVolume 
  5. Delete SetOutputVolume2
This approach requires several steps but we end up with the right interface and at no point do we break Chrome.

Results

When we implemented the above, we could fix problems as they came up rather than in big batches on each roll. We could institute the policy that the FYI bots should always be green, and that changes breaking them should be immediately rolled back. This made a huge difference. The team could work smoother and roll more often. This reduced our risk quite a bit, particularly when Chrome was about to cut a new version branch. Instead of doing panicked and risky rolls around a release, we could work out issues in good time and stay in control.

Another benefit of FYI bots is more granular performance tests. Before the FYI bots, it would frequently happen that a bunch of metrics regressed. However, it’s not fun to find which of the 100 patches in the roll caused the regression! With the FYI bots, we can see precisely which WebRTC revision caused the problem.

Future Work: Optimistic Auto-rolling

The final step on this ladder (short of actually merging the repositories) is auto-rolling. The Blink team implemented this with their ARB (AutoRollBot). The bot wakes up periodically and tries to do a roll patch. If it fails on the trybots, it waits and tries again later (perhaps the trybots failed because of a flake or other temporary error, or perhaps the error was real but has been fixed).

To pull auto-rolling off, you are going to need very good tests. That goes for any roll patch (or any patch, really), but if you’re edging closer to a release and an unstoppable flood of code changes keep breaking you, you’re not in a good place.


References

[1] Martin Fowler (May 2006) “Continuous Integration”
[2] Dani Megert, Remy Chi Jian Suen, et. al. (Oct 2014) “Evolving Java-based APIs”

Footnotes

  1. We actually did have a hilarious bug in WebRTC where it was possible to set the volume to 1.1, but only 0.0-1.0 was supposed to be allowed. No, really. Thus, our WebRTC implementation must be louder than the others since everybody knows 1.1 must be louder than 1.0.

Chrome – Firefox WebRTC Interop Test – Pt 2

by Patrik Höglund

This is the second in a series of articles about Chrome’s WebRTC Interop Test. See the first.

In the previous blog post we managed to write an automated test which got a WebRTC call between Firefox and Chrome to run. But how do we verify that the call actually worked?

Verifying the Call

Now we can launch the two browsers, but how do we figure out the whether the call actually worked? If you try opening two apprtc.appspot.com tabs in the same room, you will notice the video feeds flip over using a CSS transform, your local video is relegated to a small frame and a new big video feed with the remote video shows up. For the first version of the test, I just looked at the page in the Chrome debugger and looked for some reliable signal. As it turns out, the remoteVideo.style.opacity property will go from 0 to 1 when the call goes up and from 1 to 0 when it goes down. Since we can execute arbitrary JavaScript in the Chrome tab from the test, we can simply implement the check like this:

bool WaitForCallToComeUp(content::WebContents* tab_contents) {
// Apprtc will set remoteVideo.style.opacity to 1 when the call comes up.
std::string javascript =
"window.domAutomationController.send(remoteVideo.style.opacity)";
return test::PollingWaitUntil(javascript, "1", tab_contents);
}

Verifying Video is Playing

So getting a call up is good, but what if there is a bug where Firefox and Chrome cannot send correct video streams to each other? To check that, we needed to step up our game a bit. We decided to use our existing video detector, which looks at a video element and determines if the pixels are changing. This is a very basic check, but it’s better than nothing. To do this, we simply evaluate the .js file’s JavaScript in the context of the Chrome tab, making the functions in the file available to us. The implementation then becomes

bool DetectRemoteVideoPlaying(content::WebContents* tab_contents) {
if (!EvalInJavascriptFile(tab_contents, GetSourceDir().Append(
FILE_PATH_LITERAL(
"chrome/test/data/webrtc/test_functions.js"))))
return false;
if (!EvalInJavascriptFile(tab_contents, GetSourceDir().Append(
FILE_PATH_LITERAL(
"chrome/test/data/webrtc/video_detector.js"))))
return false;

// The remote video tag is called remoteVideo in the AppRTC code.
StartDetectingVideo(tab_contents, "remoteVideo");
WaitForVideoToPlay(tab_contents);
return true;
}

where StartDetectingVideo and WaitForVideoToPlay call the corresponding JavaScript methods in video_detector.js. If the video feed is frozen and unchanging, the test will time out and fail.

What to Send in the Call

Now we can get a call up between the browsers and detect if video is playing. But what video should we send? For chrome, we have a convenient --use-fake-device-for-media-stream flag that will make Chrome pretend there’s a webcam and present a generated video feed (which is a spinning green ball with a timestamp). This turned out to be useful since Firefox and Chrome cannot acquire the same camera at the same time, so if we didn’t use the fake device we would have two webcams plugged into the bots executing the tests!

Bots running in Chrome’s regular test infrastructure do not have either software or hardware webcams plugged into them, so this test must run on bots with webcams for Firefox to be able to acquire a camera. Fortunately, we have that in the WebRTC waterfalls in order to test that we can actually acquire hardware webcams on all platforms. We also added a check to just succeed the test when there’s no real webcam on the system since we don’t want it to fail when a dev runs it on a machine without a webcam:

if (!HasWebcamOnSystem())
return;

It would of course be better if Firefox had a similar fake device, but to my knowledge it doesn’t.

Downloading all Code and Components 

Now we have all we need to run the test and have it verify something useful. We just have the hard part left: how do we actually download all the resources we need to run this test? Recall that this is actually a three-way integration test between Chrome, Firefox and AppRTC, which require the following:

  • The AppEngine SDK in order to bring up the local AppRTC instance, 
  • The AppRTC code itself, 
  • Chrome (already present in the checkout), and 
  • Firefox nightly.

While developing the test, I initially just hand-downloaded these and installed and hard-coded the paths. This is a very bad idea in the long run. Recall that the Chromium infrastructure is comprised of thousands and thousands of machines, and while this test will only run on perhaps 5 at a time due to its webcam requirements, we don’t want manual maintenance work whenever we replace a machine. And for that matter, we definitely don’t want to download a new Firefox by hand every night and put it on the right location on the bots! So how do we automate this?

Downloading the AppEngine SDK
First, let’s start with the easy part. We don’t really care if the AppEngine SDK is up-to-date, so a relatively stale version is fine. We could have the test download it from the authoritative source, but that’s a bad idea for a couple reasons. First, it updates outside our control. Second, there could be anti-robot measures on the page. Third, the download will likely be unreliable and fail the test occasionally.

The way we solved this was to upload a copy of the SDK to a Google storage bucket under our control and download it using the depot_tools script download_from_google_storage.py. This is a lot more reliable than an external website and will not download the SDK if we already have the right version on the bot.

Downloading the AppRTC Code
This code is on GitHub. Experience has shown that git clone commands run against GitHub will fail every now and then, and fail the test. We could either write some retry mechanism, but we have found it’s better to simply mirror the git repository in Chromium’s internal mirrors, which are closer to our bots and thereby more reliable from our perspective. The pull is done by a Chromium DEPS file (which is Chromium’s dependency provisioning framework).

Downloading Firefox
It turns out that Firefox supplies handy libraries for this task. We’re using mozdownload in this script in order to download the Firefox nightly build. Unfortunately this fails every now and then so we would like to have some retry mechanism, or we could write some mechanism to “mirror” the Firefox nightly build in some location we control.

Putting it Together

With that, we have everything we need to deploy the test. You can see the final code here.

The provisioning code above was put into a separate “.gclient solution” so that regular Chrome devs and bots are not burdened with downloading hundreds of megs of SDKs and code that they will not use. When this test runs, you will first see a Chrome browser pop up, which will ensure the local apprtc instance is up. Then a Firefox browser will pop up. They will each acquire the fake device and real camera, respectively, and after a short delay the AppRTC call will come up, proving that video interop is working.

This is a complicated and expensive test, but we believe it is worth it to keep the main interop case under automation this way, especially as the spec evolves and the browsers are in varying states of implementation.

Future Work

  • Also run on Windows/Mac. 
  • Also test Opera. 
  • Interop between Chrome/Firefox mobile and desktop browsers. 
  • Also ensure audio is playing. 
  • Measure bandwidth stats, video quality, etc.


Chrome – Firefox WebRTC Interop Test – Pt 1

by Patrik Höglund

WebRTC enables real time peer-to-peer video and voice transfer in the browser, making it possible to build, among other things, a working video chat with a small amount of Python and JavaScript. As a web standard, it has several unusual properties which makes it hard to test. A regular web standard generally accepts HTML text and yields a bitmap as output (what you see in the browser). For WebRTC, we have real-time RTP media streams on one side being sent to another WebRTC-enabled endpoint. These RTP packets have been jumping across NAT, through firewalls and perhaps through TURN servers to deliver hopefully stutter-free and low latency media.

WebRTC is probably the only web standard in which we need to test direct communication between Chrome and other browsers. Remember, WebRTC builds on peer-to-peer technology, which means we talk directly between browsers rather than through a server. Chrome, Firefox and Opera have announced support for WebRTC so far. To test interoperability, we set out to build an automated test to ensure that Chrome and Firefox can get a call up. This article describes how we implemented such a test and the tradeoffs we made along the way.

Calling in WebRTC

Setting up a WebRTC call requires passing SDP blobs over a signaling connection. These blobs contain information on the capabilities of the endpoint, such as what media formats it supports and what preferences it has (for instance, perhaps the endpoint has VP8 decoding hardware, which means the endpoint will handle VP8 more efficiently than, say, H.264). By sending these blobs the endpoints can agree on what media format they will be sending between themselves and how to traverse the network between them. Once that is done, the browsers will talk directly to each other, and nothing gets sent over the signaling connection.

Figure 1. Signaling and media connections.

How these blobs are sent is up to the application. Usually the browsers connect to some server which mediates the connection between the browsers, for instance by using a contact list or a room number. The AppRTC reference application uses room numbers to pair up browsers and sends the SDP blobs from the browsers through the AppRTC server.

Test Design

Instead of designing a new signaling solution from scratch, we chose to use the AppRTC application we already had. This has the additional benefit of testing the AppRTC code, which we are also maintaining. We could also have used the small peerconnection_server binary and some JavaScript, which would give us additional flexibility in what to test. We chose to go with AppRTC since it effectively implements the signaling for us, leading to much less test code.

We assumed we would be able to get hold of the latest nightly Firefox and be able to launch that with a given URL. For the Chrome side, we assumed we would be running in a browser test, i.e. on a complete Chrome with some test scaffolding around it. For the first sketch of the test, we imagined just connecting the browsers to the live apprtc.appspot.com with some random room number. If the call got established, we would be able to look at the remote video feed on the Chrome side and verify that video was playing (for instance using the video+canvas grab trick). Furthermore, we could verify that audio was playing, for instance by using WebRTC getStats to measure the audio track energy level.

Figure 2. Basic test design.

However, since we like tests to be hermetic, this isn’t a good design. I can see several problems. For example, if the network between us and AppRTC is unreliable. Also, what if someone has occupied myroomid? If that were the case, the test would fail and we would be none the wiser. So to make this thing work, we would have to find some way to bring up the AppRTC instance on localhost to make our test hermetic.

Bringing up AppRTC on localhost

AppRTC is a Google App Engine application. As this hello world example demonstrates, one can test applications locally with
google_appengine/dev_appserver.py apprtc_code/

So why not just call this from our test? It turns out we need to solve some complicated problems first, like how to ensure the AppEngine SDK and the AppRTC code is actually available on the executing machine, but we’ll get to that later. Let’s assume for now that stuff is just available. We can now write the browser test code to launch the local instance:
bool LaunchApprtcInstanceOnLocalhost() 
// ... Figure out locations of SDK and apprtc code ...
CommandLine command_line(CommandLine::NO_PROGRAM);
EXPECT_TRUE(GetPythonCommand(&command_line));

command_line.AppendArgPath(appengine_dev_appserver);
command_line.AppendArgPath(apprtc_dir);
command_line.AppendArg("--port=9999");
command_line.AppendArg("--admin_port=9998");
command_line.AppendArg("--skip_sdk_update_check");

VLOG(1) << "Running " << command_line.GetCommandLineString();
return base::LaunchProcess(command_line, base::LaunchOptions(),
&dev_appserver_);
}

That’s pretty straightforward [1].

Figuring out Whether the Local Server is Up 

Then we ran into a very typical test problem. So we have the code to get the server up, and launching the two browsers to connect to http://localhost:9999?r=some_room is easy. But how do we know when to connect? When I first ran the test, it would work sometimes and sometimes not depending on if the server had time to get up.

It’s tempting in these situations to just add a sleep to give the server time to get up. Don’t do that. That will result in a test that is flaky and/or slow. In these situations we need to identify what we’re really waiting for. We could probably monitor the stdout of the dev_appserver.py and look for some message that says “Server is up!” or equivalent. However, we’re really waiting for the server to be able to serve web pages, and since we have two browsers that are really good at connecting to servers, why not use them? Consider this code.
bool LocalApprtcInstanceIsUp() {
// Load the admin page and see if we manage to load it right.
ui_test_utils::NavigateToURL(browser(), GURL("localhost:9998"));
content::WebContents* tab_contents =
browser()->tab_strip_model()->GetActiveWebContents();
std::string javascript =
"window.domAutomationController.send(document.title)";
std::string result;
if (!content::ExecuteScriptAndExtractString(tab_contents,
javascript,
&result))
return false;

return result == kTitlePageOfAppEngineAdminPage;
}

Here we ask Chrome to load the AppEngine admin page for the local server (we set the admin port to 9998 earlier, remember?) and ask it what its title is. If that title is “Instances”, the admin page has been displayed, and the server must be up. If the server isn’t up, Chrome will fail to load the page and the title will be something like “localhost:9999 is not available”.

Then, we can just do this from the test:
while (!LocalApprtcInstanceIsUp())
VLOG(1) << "Waiting for AppRTC to come up...";

If the server never comes up, for whatever reason, the test will just time out in that loop. If it comes up we can safely proceed with the rest of test.

Launching the Browsers 

A browser window launches itself as a part of every Chromium browser test. It’s also easy for the test to control the command line switches the browser will run under.

We have less control over the Firefox browser since it is the “foreign” browser in this test, but we can still pass command-line options to it when we invoke the Firefox process. To make this easier, Mozilla provides a Python library called mozrunner. Using that we can set up a launcher python script we can invoke from the test:
from mozprofile import profile
from mozrunner import runner

WEBRTC_PREFERENCES = {
'media.navigator.permission.disabled': True,
}

def main():
# Set up flags, handle SIGTERM, etc
# ...
firefox_profile =
profile.FirefoxProfile(preferences=WEBRTC_PREFERENCES)
firefox_runner = runner.FirefoxRunner(
profile=firefox_profile, binary=options.binary,
cmdargs=[options.webpage])

firefox_runner.start()

Notice that we need to pass special preferences to make Firefox accept the getUserMedia prompt. Otherwise, the test would get stuck on the prompt and we would be unable to set up a call. Alternatively, we could employ some kind of clickbot to click “Allow” on the prompt when it pops up, but that is way harder to set up.

Without going into too much detail, the code for launching the browsers becomes
GURL room_url = 
GURL(base::StringPrintf("http://localhost:9999?r=room_%d",
base::RandInt(0, 65536)));
content::WebContents* chrome_tab =
OpenPageAndAcceptUserMedia(room_url);
ASSERT_TRUE(LaunchFirefoxWithUrl(room_url));

Where LaunchFirefoxWithUrl essentially runs this:
run_firefox_webrtc.py --binary /path/to/firefox --webpage http://localhost::9999?r=my_room

Now we can launch the two browsers. Next time we will look at how we actually verify that the call worked, and how we actually download all resources needed by the test in a maintainable and automated manner. Stay tuned!


1The explicit ports are because the default ports collided on the bots we were running on, and the --skip_sdk_update_check was because the SDK stopped and asked us something if there was an update.