Tag Archives: Google Integrations

Deeper Integration of Search Console in Google Analytics

Google Analytics helps brands optimize their websites and marketing efforts for all sources of traffic, and Search Console is where website owners manage how they appear in Google organic search results. Today, we are introducing the ability to display Search Console metrics alongside Google Analytics metrics, in the same reports, side by side - giving you a full view of how your site shows up and performs in organic search results.

For years, users of both Search Console and Google Analytics have been able to link the two properties (instructions) and see Search Console statistics in Google Analytics, in isolation. But to gain a fuller picture of your website’s performance in organic search, it’s beneficial to see how visitors reached your site and what they did once they got there.

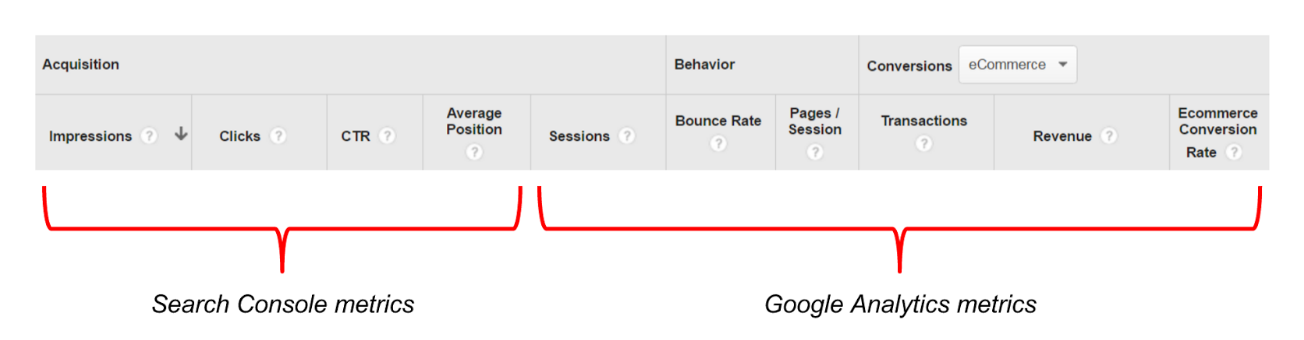
With this update, you’ll be able to see your Search Console metrics and your Google Analytics metrics in the same reports, in parallel. By combining data from both sources at the landing page level, we’re able to show you a full range of Acquisition, Behavior and Conversion metrics for your organic search traffic. This feature out is rolling out over the coming few weeks, so not everyone will see it immediately.


New Search Console reports combine Search Console and Google Analytics metrics

New Insights

The new reports allow you to examine your organic search data end-to-end and discover unique and actionable insights. Your Acquisition metrics from Search Console, such as impressions and average position, are now available in relation to your Behavior and Conversion metrics from Google Analytics, like bounce rate and pages per session.

Below are some new capabilities resulting from this improved integration:
 • Find landing pages that are attracting many users through Google organic search (e.g., high impressions and high click through rate) but where users are not engaging with the website. In this case, you should consider improving your landing pages.

 • Find landing pages that have high site engagement but are not successfully attracting users from Google organic search  (e.g., have low click through rate). In this case, you might benefit from improving titles and descriptions shown in search.

 • Learn which queries are ranking well for each organic landing page.

 • Segment organic performance by device category (desktop, tablet, mobile) in the new Devices report.
 

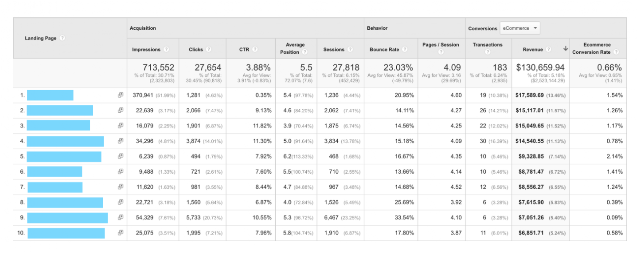
New Landing Page report showing Search Console and Google Analytics metrics


Additional Information 

Each of these new reports will display how your organic search traffic performs. As data is joined at the landing page level, Landing Pages, Countries and Devices will show both Search Console and Google Analytics data, while the Queries report will only show Search Console data for individual queries. The same search queries will display in Google Analytics as you see in Search Console today.

As mentioned in our Search Console Help Center, some data may not be displayed, to protect user privacy. For example, Search Console may not track some infrequent queries, and will not display those that include personal or sensitive information.

Also, while the data is displayed in parallel, not all Google Analytics features are available for Search Console data - including segmentation. Any segment that is applied to the new combined reports will only apply to Google Analytics data. You may also see that clicks from Search Console may differ from total sessions in Google Analytics.

 To experience the new combined reports from Search Console and Google Analytics, make sure your properties are linked, and then navigate to the new section “Search Console”, which should appear under “Acquisition” in the left-hand navigation in Google Analytics.

Posted by Joan Arensman, Product Manager, and Daniel Waisberg, Analytics Advocate

Spotlight: Smarter Marketing with Analytics 360, part of the Google Analytics 360 Suite

On the Google Analytics team, we believe a primary goal of analytics is to make your marketing smarter.  It should help you understand your customer’s journey, gain and share insights, and create an engaging experience for your audience.

But just as your organization can’t achieve these goals in a silo, neither can your website analytics data.  Your customer’s journey includes both their experience with your marketing campaigns as well as their experience on your sites and apps.  So you need complete data, connected from marketing through to site experience, to actually gain insight and deliver a great customer experience.  

Analytics 360, part of the Google Analytics 360 Suite, is proud to provide this type of end-to-end understanding with our existing AdWords integrations. Beginning today, we are now offering this same capability with the DoubleClick Digital Marketing platform.  In addition to our existing integration with DoubleClick Campaign Manager, you can now view user engagement information for users acquired through DoubleClick Bid Manager and DoubleClick Search campaigns directly within Analytics 360.  It’s super easy to connect your Analytics 360 account to DoubleClick Digital Marketing and there’s no implementation work needed (e.g. no site or campaign re-tagging).

With these new capabilities, marketers using Analytics 360 are better able to see the customer journey from when a customer was exposed to their marketing campaigns all the way through to that customer’s eventual purchase on their site (or lack thereof).  User engagement with your site can be analyzed for both users who viewed an ad (view-through) and for users who clicked on an ad (click-through). View-through information is especially important for display, video, and mobile because users often view these ads and then visit the website later rather than clicking directly on the ad.  

Companies like Panasonic are already using our integrations with marketing media to improve their return on investment (ROI) from digital marketing campaigns.  With the Analytics 360 ads integrations, Panasonic was able to aggregate all digital campaign data into one platform to gain insight about their customers.  They then shared these insights back to their media tools to better find engaged audiences and provide those audiences with the right experience at the right moment, driving an ROI increase of 30%

In light of these latest integrations with Google ad technologies, we wanted to take a moment to discuss the two capabilities we enable across all our ads integrations that help you achieve smarter marketing:  1) understanding the customer and their journey and 2) creating relevant experiences for users.


Understanding the customer and their journey

They saw and / or clicked on your ad and arrived on your site.  But who are they?  What happened next?  Did they bounce immediately?  Did they research specific products?  Did they sign up for your newsletter?  What were the users who interacted with your digital marketing doing on your site?  Ads integrations with Analytics 360 can help you answer these questions and more, for example:
  • You are launching a new product and start running display and search advertising campaigns to attract customers.  You find that one campaign has a low conversion rate and you’re considering deprecating it.  But you review your site analytics data for this campaign and find that some specific ad exchanges and certain keywords are driving many new users to your site.  And some of these exchanges and keywords are driving new users who are highly engaged — they view a lot of product detail pages and spend a lot of time on your site. So, instead of shutting down the campaign, you refine the targeting for the ads in this campaign to focus more on the ad exchanges and the keywords that drive engaged new users to your site.  Then, you create a remarketing campaign to bring these engaged new users back to your site for purchase.
  • One of your campaigns drives a lot of click and view-throughs, but has a low conversion rate.  Analysis in Analytics 360 reveals that most users bounce immediately, but a certain segment who click on or view that ad (e.g. women aged 18-35) have a really high conversion rate.  You refine the messaging and creative in your ads, adjust where these ads are served, and bid higher in order to find and attract more of this high-performing audience.
Creating relevant experiences for users
User behavior on your site can tell you a lot about them and what they’re interested in.  Shouldn’t you use that information to inform your marketing strategy? Some examples:
  • You run a shopping site and have users who spend a lot of time looking at an item or even put that item in their cart, but don’t end up purchasing.  At the end of the season, the clothes on your site go on sale.  You create remarketing campaigns to these users who showed interest but never purchased letting them know that the item they were interested in is now on sale.
  • You are a cable company and you’d like to offer your new online streaming HDTV service to existing customers who subscribe to your high speed Internet plan.  You create remarketing ads for customers who have the high speed plan, driving higher lifetime value for these customers.
These are just a few examples of how analytics data can blend with campaign data to create real value for both companies and for their customers. It's a win-win — customers get marketing that is truly relevant to them, and companies put their marketing dollars to work with the customers who are most likely to be interested.  

Visit the Google Analytics 360 Suite Help Center to learn more about our new integrations with DoubleClick Bid Manager and DoubleClick Search.  You can also learn about our existing integrations DoubleClick Campaign Manager and with AdWords.  Stay tuned for more updates from Analytics 360 as we continue to invest in new and exciting capabilities. Happy analyzing!

Google Apps Script: Tracking add-on usage with Google Analytics

The following was originally published on the Google Developers Blog.

Editor's note: Posted by Romain Vialard, a Google Developer Expert and developer of Yet Another Mail Merge, a Google Sheets add-on.

Google Apps Script makes it easy to create and publish add-ons for Google Sheets, Docs, and Forms. There are now hundreds of add-ons available and many are reaching hundreds of thousands of users. Google Analytics is one of the best tools to learn what keeps those users engaged and what should be improved to make an add-on more successful.

Cookies and User Identification

Add-ons run inside Google Sheets, Docs, and Forms where they can display content in dialogs or sidebars. These custom interfaces are served by the Apps Script HTML service, which offers client-side HTML, CSS, and JS with a few limitations.

Among those limitations, cookies aren’t persistent. The Google Analytics cookie will be recreated each time a user re-opens your dialog or sidebar, with a new client ID every time. So, Analytics will see each new session as if initiated by a new user, meaning the number of sessions and number of users should be very similar.

Fortunately, it’s possible to use localStorage to store the client ID — a better way to persist user information instead of cookies. After this change, your user metrics should be far more accurate.

Add-ons can also run via triggers, executing code at a recurring interval or when a user performs an action like opening a document or responding to a Google Form. In those cases, there’s no dialog or sidebar, so you should use the Google Analytics Measurement Protocol (see policies on the use of this service) to send  user interaction data directly to Google Analytics servers via the UrlFetch service in Google Apps Script.

A Client ID is also required in that case, so I recommend using the Apps Script User properties service. Most examples on the web show how to generate a unique Client ID for every call to Analytics but this won’t give you an accurate user count.

You can also send the client ID generated on client side to the server so as to use the same client ID for both client and server calls to Analytics, but at this stage, it is best to rely on the optional User ID in Google Analytics. While the client ID represents a client / device, the User ID is unique to each user and can easily be used in add-ons as users are authenticated. You can generate a User ID on the server side, store it among the user properties, and reuse it for every call to Analytics (both on the client and the server side). 

Custom Dimensions & Metrics
In add-ons, we usually rely on event tracking and not page views. It is possible to add different parameters on each event thanks to categories, actions, labels and value, but it’s also possible to add much more info by using custom dimensions & metrics.

For example, the Yet Another Mail Merge add-on is mostly used to send emails, and we have added many custom dimensions to better understand how it is used. For each new campaign (batch of emails sent), we record data linked to the user (e.g. free or paying customer, gmail.com or Google for Work / EDU user) and data linked to the campaign (e.g. email size, email tracking activated or not). You can then reuse those custom dimensions inside custom reports & dashboards.

Click for full-size version
Once you begin to leverage all that, you can get very insightful data. Until October 2015, Yet Another Mail Merge let you send up to 100 emails per day for free. But we’ve discovered with Analytics that most people sending more than 50 emails in one campaign were actually sending 100 emails - all the free quota they could get - but we failed to motivate them to switch to our paid plan.

Click for full-size version

As a result of this insight, we have reduced this free plan to 50 emails/day and at the same time introduced a referral program, letting users get more quota for free (they still don’t pay but they invite more users so it’s interesting for us). With this change, we have greatly improved our revenue and scaled user growth.

Or course, we also use Google Analytics to track the efficiency of our referral program.

To help you get started in giving you more insight into your add-ons, below are some relevant pages from our documentation on the tools described in this post. We hope this information will help your apps become more successful:
Posted by Romain Vialard, Google Developer Expert. After some years spent as a Google Apps consultant, he is now focused on products for Google Apps users, including add-ons such as Yet Another Mail Merge and Form Publisher.

Remarketing Lists for Search Ads, Powered by Google Analytics

Today we’re excited to announce you can use audiences (previously remarketing lists) created in Google Analytics to reach your customers on Google Search, with no tagging changes required. 

Remarketing Lists for Search Ads (RLSA) allows you to tailor your search ads and based on your visitors' past activity on your website. Now you can leverage more than 200 Google Analytics dimensions and metrics to create and activate your audiences for remarketing, then use those audiences to reach and re-engage your customers with a consistent message across both Google Search and Display.

TransUnion cuts CPA in half with RLSA

In order to find more customers while reducing waste in their search campaigns, TransUnion, a leading financial services provider, used the audience creation capabilities in Google Analytics to spend more efficiently on Google Search.

TransUnion started by creating two audiences. The first was for new customers―those who had visited the site and started, but not completed a credit application. The other included customers who had already converted. Splitting the audience between new and existing customers allowed TransUnion to bid higher on Google search ads for new customers and spend less on converted customers.

The new RLSA capabilities in Google Analytics yielded impressive conversion rates and cost efficiencies for TransUnion's search campaigns. RLSA visitors had a lower bounce rate and viewed twice as many pages per session compared with regular visitors. 

By using more tailored text with their remarketing lists, TransUnion increased their conversion rate by 65% and average transaction value by 58%. Meanwhile, CPCs for existing customers dropped 50%, resulting in a roughly 50% drop in their cost per transaction. Read the full case study here

How to get started

Getting started with RLSA is easier than ever before thanks to Instant Activation. Within the Admin tab, simply click Property, then Tracking Info, and finally Data Collection. Ensure that Remarketing is set to ‘ON.’


Once you’ve enabled this setting, all your eligible audiences will begin to populate for RLSA.

Building Audiences

If you’d like to create new audiences, there are three ways to get started. 

First, you can create a new audience using the Audience builder in the remarketing section of the Admin tab. Make sure you select the relevant AdWords account to share your audience with for remarketing.

Admin Remarketing.png

If you have an existing segment you’d like to turn into an audience, simply click on the segment options and select “Build Audience” right from within reporting. This option will take you directly to the audience builder as above.  

Segment Remarketing.png
Finally, you can get started quickly and easily by importing audiences from the Google Analytics Solutions Gallery.

Activating audiences in AdWords

Once you have shared an audience with AdWords, it will appear instantly in your AdWords Shared Library and will show eligible users in the column List size (Google search).  Keep in mind that an audience must accumulate a minimum of 1,000 users before you can use it for remarketing on Google Search. To get started, follow the instructions in the AdWords Help Center


Support for RLSA with Google Analytics is part of an ongoing investment to provide powerful ways to activate your customer insights in Google Analytics, along with recent features like Cohort Analysis, Lifetime Value Analysis, and Active User Reporting. Stay tuned for more announcements!

Happy Analyzing,
Lan Huang, Technical Lead, Google Analytics,
Xiaorui Gan, Technical Lead, Google Search Ads

BT Increases Sales Volume and Efficiency Using DoubleClick Bid Manager With Google Analytics Premium

Cross-posted on the DoubleClick Advertiser Blog

Modern marketers live in a world that’s dominated by data. Advancements in programmatic buying enable marketers to leverage data and analytics to connect precisely, in real time. Advertisers who are smart about organizing, segmenting, and acting on this data are realizing the benefits of more personalized marketing. BT, a leading telecommunications firm in the UK, did just that and saw fantastic results.  

BT wanted to increase the relevance of their remarketing campaigns by creating more precise audience lists. With the help of their media agency Maxus, BT found that using Google Analytics Premium with DoubleClick Bid Manager offered the ideal solution. 

Google Analytics Premium gave BT the ability to create granular audience segments based on site behavior metrics such as recency, frequency, referral source, and stage of cart abandonment. Once these audience lists were created, the native integration between Google Analytics Premium and DoubleClick Bid Manager meant they could be shared with the platform to make more precise media buys in just a few clicks.

Using Google Analytics Premium with DoubleClick Bid Manager put Maxus and BT in the driver’s seat of their media campaigns. They not only gleaned full transparency with a single customer view and de-duplicated metrics across all channels, but also saw better measurement through unified reporting, and the ability to optimize based on the results.


”Our goals were to build up ‘best practices’ of programmatic display remarketing techniques with a focus on driving post-click sales,” says Alison Thorburn, Head of Digital DR Media at BT. “The DoubleClick suite of products enabled us to do this quickly and efficiently as audience data can be easily organized and utilized.” 

The new analytics-driven approach produced a 69% increase in post-click sales and an 87% reduction in post-click cost per acquisition compared to the previous year’s remarketing activity. It also compared favorably to the remarketing activity that ran simultaneously outside of DoubleClick Bid Manager; post-click sales were 30% higher and post-click cost per acquisition was 42% lower. BT has now consolidated its display remarketing through DoubleClick BidManager.
Read the full case study here.

Posted by-
Kelley Sternhagen, Product Marketing, Google Analytics
Kelly Cox, Product Marketing, DoubleClick

Marketo Scores 10X Higher Conversion Rate With Google Analytics


"Google Analytics has helped us increase the effectiveness of our AdWords remarketing campaigns by improving the targeting of our audiences and allowing us to present more relevant ads." 
Mike Telem, VP of Product Marketing at Marketo 

Marketo, a leading marketing automation company, is a strategic partner for thousands of companies. To take their own marketing to the next level, Marketo needed an analytics platform that was flexible enough to combine external data with user site behavior. They wanted to seamlessly leverage that data to improve the relevance of their marketing.

Marketo used a two-step approach for their marketing: first they used Marketo's Real-Time Personalization (RTP) product to identify characteristics—such as product interest and industry type—of Marketo's website visitors. Then they passed this data to Google Analytics in the form of events. This allowed Marketo to see Google Analytics visitor demographics and behavior information next to Marketo's RTP-identified characteristics for a more holistic picture of their user base in Google Analytics.

Using Google Analytics as the single source for customer data, Marketo segmented audiences in Analytics based on conversion stage or business vertical. With native integrations between Google Analytics and AdWords, Marketo was able to pass these specialized remarketing lists to AdWords and serve more personalized remarketing ads to its users in just a few, easy clicks.

These tailored ads had a huge impact and Marketo saw a jump in both engagement and conversions. Across the board, remarketing with Google Analytics drove a 10X higher conversion rate compared to traditional display marketing campaigns. Marketo also saw 200% more conversions in its B2C segment and an increase of 150% in conversions for its enterprise visitors.

To read the full case study, click here

Posted by: Kelley Sternhagen, Google Analytics Marketing 

Start Remarketing with Google Analytics Instant Activation

For many advertisers, remarketing is an essential tactic. But remarketing can be a difficult journey, even for the savviest digital marketer. We repeatedly see marketers struggle with tagging hurdles and complex implementation challenges, with the result that only 1 in 5 remarketers successfully completes their setup.

To help make it easier for advertisers to reach their most qualified customers, we’ve enabled remarketing with a single toggle. Instead of manually updating all of your site tags, simply use Instant Activation and get started with remarketing in four easy steps.

Identifying quality visitors and maximizing conversions

GlobalTechLED.com is a producer of LED lighting. Thanks to Instant Activation, John Burns, Director of Marketing, was able to start remarketing quickly. Without waiting for IT to re-tag his site, John successfully launched Global Tech LED’s first remarketing campaign and saw fast results by reaching their highest potential customers.

After enabling remarketing, Global Tech LED leveraged Google’s powerful machine-learning technology in two ways for their online campaigns: Smart Lists for remarketing automatically created lists of visitors who were most likely to engage in a subsequent session on GlobalTechLED.com. Then, Conversion Optimizer instantly adjusted the campaigns’ bids get more conversions at a lower cost, eventually freeing up more time and resources for the company.

As a result, GlobalTechLED.com is currently reaching their performance and outreach goals. To date they’ve doubled their display campaigns’ CTRs and have almost five times more clicks on their remarketing campaign compared to their other campaigns. Website traffic increased by over 100% in the first 30 days of the campaign, and international traffic skyrocketed. They’ve also seen a 75% decrease in CPA for their campaigns.

These kind of results were exactly what the company was looking for. According to John, "We’ve been trying to hit these specific numbers in the account for a couple of months, and Google Analytics Remarketing helped us achieve these in only a couple of days." Read the full case study here.

Four easy steps to get started

Ready to get started with remarketing? You can, with just four steps.

1. In your Google Analytics Property’s settings, choose ‘Audiences’ under the ‘Remarketing’ section.


2. Choose the AdWords account where you’d like to share your Audience and click ‘Next Step’.


3. Click “Enable” to create your first audience of All Users.  You can also come back later and create more complex audiences, like ‘visitors who have spent more than six minutes on site’, ‘visitors who visited more than five pages’, or ‘abandoned cart’.

This step automatically activates Advertiser Features if you haven’t done so already, which also enables Audience Demographics and Interests Reporting. You can manage this setting at any time in the Admin tab, under the ‘Advertiser Features’ section in your Property Settings.


4. Click ‘Create Campaign’ and complete the remarketing campaign creation process in AdWords. Congratulations, you are now a Remarketer!


We’re really excited to make Advertiser Features in Google Analytics simpler and enable all Google Analytics users to be more successful across all their marketing channels. Stay tuned for future improvements!

Happy Analyzing!

Posted by Avi Mehta and Rosanne Borja, Google Analytics Team

Simplify your Google Analytics Reporting with Add-ons for Google Sheets

It's common for Google Analytics users to use spreadsheets to analyze their Google Analytics data or combine it with another data source. But exporting your data from Google Analytics to Google Sheets is a manual process, and it can be tedious if you run reports frequently or manage multiple accounts. With the release of Add-ons for Google Sheets, getting your Google Analytics data into Google Sheets has never been easier!

Add-ons allow you to extend the power of Google Sheets by automating common tasks and integrating with external services. The Google Analytics Spreadsheet Add-on allows you to access your Google Analytics data, right from within a spreadsheet!


The Google Analytics Spreadsheet Add-on
The Google Analytics Spreadsheet Add-on combines the power of the Google Analytics API with the rich feature set of Google Sheets, making it easier for Google Analytics users to access, visualize, share, and manage their data. With this add-on you can:
  • Query and report data from multiple views.
  • Compute and display custom calculations.
  • Create visualizations and embed those visualizations on third-party websites.
  • Schedule your reports to run and update automatically.
  • Control who can see your data and visualizations by using Google Sheets' sharing and privacy features.
But perhaps the best way to find out what the Google Analytics Spreadsheet Add-on can do is to see it in action. In this short video I introduce the add-on, show you how to install it, and walk you through creating your first report.


If you want to go deeper, you can watch this more advanced video where I explain in detail the process of building a complete dashboard that automatically updates and can be embedded on a third-party website.


If you have more questions about how to use the add-on, check out the documentation. It explains each of its features and configuration options in much more detail.

Supermetrics and Analytics Canvas add-ons
The Google Analytics Spreadsheet Add-on gives users a powerful yet user-friendly way to access their Google Analytics data, but it doesn't solve all business integration needs.

For more advanced business and data-integration solutions, I strongly recommend trying out these two excellent Google Sheets add-ons created by our technology partners:
Both of these add-ons integrate with Google Analytics as well as a variety of other platforms and services such as Facebook, Twitter, Microsoft Office, and many more. Free and premium versions are available. 

Feedback and Support
Add-ons are a great way to automate the process of getting your Google Analytics data into Google Sheets. We hope you take the time to try out these add-ons and see how they can improve your workflow.

If you use the Google Analytics Spreadsheet Add-on, we'd love to know what you think. You can leave a review in the Chrome Web Store, ask any questions you have in the add-on discussion group, or submit feedback directly from within Google Sheets.

Any and all feedback is welcome!

By: Philip Walton, Developer Programs Engineer, Google Analytics

With Google Analytics Premium and DoubleClick: Matalan increases conversion rate 28%

This post originally appeared on the DoubleClick Advertiser blog as part of the with DoubleClick series, highlighting stories and perspectives from industry leaders about how they are succeeding with an integrated digital marketing platform.

As one of the UK's leading family clothing retailers, Matalan must be nimble -- faster decisions mean better customer engagement and more sales. So they worked with Morpheus Media to implement Google Analytics Premium with DoubleClick Campaign Manager. Google Analytics' powerful insights helped Matalan make better business decisions, faster.

Matalan was already using DoubleClick Campaign Manager to centralize their digital marketing and reports. Adding Google Analytics Premium side-by-side showed them campaign effectiveness even more clearly, allowing them to uncover the hidden value of their digital marketing efforts, like transactions where digital advertising had assisted a conversion on another channel.

“It’s really helpful to be able to see one channel that might not be a heavy hitter in terms of revenue or traffic has an impact in creating a conversion on another channel,” says Lee Pinnington, Matalan's Multi-Channel Marketing Director.


With a complete view of their digital marketing ROI thanks to the integration of DoubleClick Campaign Manager and Google Analytics Premium, Matalan was able to put their marketing dollars where they would truly be most effective. And the results were dramatic: a 28% rise in conversion rate and significant growth in both site visits and revenue.

To learn more about Matalan's approach, check out the full case study.

Optimizing AdSense Revenue Using Google Analytics

Recently Google Analytics launched two important new capabilities for its AdSense integration: AdSense Exits reports and AdSense Revenue as an experiment objective. They both come as a great additions to websites that use AdSense for monetization. In this post I will go over the the AdSense Analytics integration and how it can be used to optimize AdSense revenue.

Integrating AdSense and Google Analytics

Before going further into the wonders of the Analytics AdSense marriage, you should first be sure that your accounts are linked properly. Here is how to do it. First follow the steps in the screenshot below after logging into Google Analytics (Admin => AdSense Linking => Link Accounts): 

AdSense and Analytics Integration (click for full size)

You will be sent to your AdSense account in order to confirm the linking and then you will be sent back to Google Analytics to choose which profiles should include this data. If you have any problems or additional questions, take a look at the AdSense Help Center. After the integration is complete the following metrics will be available on your Google Analytics account:
  • AdSense revenue: revenue generated by AdSense ads.
  • Ads clicked: the number of times AdSense ads were clicked.
  • AdSense CTR (click-through rate): the percentage of page impressions that resulted in a click on an ad.
  • AdSense eCPM: AdSense revenue per 1,000 page impressions.
  • AdSense ads viewed: number of ads viewed.
  • AdSense Page Impressions: the number of pageviews during which an ad was displayed.

AdSense Reports On Google Analytics

Currently, there are 3 out-of-the-box AdSense reports available on Analytics: Pages, Referrers and Exits. You can find them here (direct link to report).

1. AdSense Pages

This report provides information about which pages contributed most to AdSense revenue. It will show each of the pages on the website and how well they performed in terms of AdSense. For each page in the website that contains an AdSense unit we will be able to analyze the following metrics: AdSense revenue, AdSense ads clicked, AdSense CTR, AdSense eCPM, AdSense ads viewed and AdSense page impressions. 

This report provides an interesting view of which page performed best, and it can be used to optimize website content. For example, if you find that posts about celebrities generate more revenue than posts about soccer, you might consider writing more about celebrities (if your main objective is to make money on AdSense.)

2. AdSense Referrers

This report provides information about the performance of domains that referred visitors who generated AdSense revenue. This information is extremely valuable; however, I suggest using a different report, since it provides more in-depth information: “All Traffic”. 

The AdSense Referrers only displays information about websites that generated AdSense Revenue, it does not provide information on other types of traffic sources and campaigns. For this reason, I believe the All Traffic report presents a more complete view. To find the report, go to this page (direct link to report) and click on the AdSense tab just above the chart.

3. AdSense Exits

AdSense Exit report shows the number of sessions that ended due to a user clicking on an AdSense ad. This is an interesting metric as it can show which pages have a "high conversion rate", i.e. the ratio of visits to a page and those that left the website clicking on an AdSense unit through it. If your monetization is made through AdSense this report will give just that: AdSense conversion rate per page.

Optimizing AdSense revenue using Google Analytics

Below is an example of how to use the integration from my Analytics for Publishers eBook. Most websites work with templates and each template may have different AdSense placements; this means that an important analysis would be to compare performance by template (or by category) rather than by page. 

In order to analyze template performance, we will need to create one segment per template. If you want to learn more about creating Segments, check this Help Center article. For example, let’s suppose your website has the following page templates:
  • Analytics pages with URLs structured as example.com/analytics/...
  • Testing pages with URLs structured as example.com/testing/...
  • Targeting pages with URLs structured as example.com/targeting/...
In this case you would create three segments using the dimension Page, each containing its unique pattern: /analytics/ for analytics pages, /testing/ for testing pages, and /targeting/ for targeting pages. Below is an example of how the segment would look for the analytics pages: 

Analyzing template performance using segments (click for full size) 

After creating the segments for all three templates, you will be able to choose all of them in the top-left corner of the screen (just above the chart, see bubble #1 above) to see a comparison between them. Below is a screenshot showing how such a comparison would look like: 

Table comparison metrics for different visitor segments (click for full size)
In the table above we are able to compare pages by all metrics available. For example, we can see that while the Analytics section has higher revenue, this is related to the number of impressions, which is also significantly higher. When we analyze further, we see that the Testing and Targeting sections have a good potential, with the same CTR but significantly higher AdSense eCPM. Based on these metrics we can understand which templates and content types are the most effective. 

As mentioned above, once you find out which pages are performing well and which pages are not, you can use Content Experiments to optimize them. Here is a Content Experiments guide.

Closing Thoughts

Here are a few takeaways for you to start optimizing today!
  1. Understand which content type and subject generates the highest revenue and create content based on this data.
  2. Understand which page templates bring the best results by using advanced segments.
  3. Analyze AdSense performance to learn which segments have a good CTR; this might bring insight into which audience to target.