Tag Archives: Analytics 360

Google Measurement Partners: Trusted measurement solutions for the entire customer journey

We believe that measurement you can trust is critical for brands trying to understand the impact of their marketing. But as the customer journey has become more complex, measurement has become increasingly challenging. And while Google strives to build great solutions, some marketers prefer to rely on third-party measurement solutions.

That’s why we’re announcing Google Measurement Partners, a program that brings together new and existing partnerships to offer brands a variety of options to measure their advertising media.

The program is launching with 20+ verified partners across seven specializations: viewability, reach, brand safety, brand lift, sales lift, app attribution, and marketing mix modeling. Partners offer various solutions that work across Google advertising products, including Google Marketing Platform (including Display & Video 360 and Search Ads 360), Google Ads, YouTube, and more. Existing partner programs like App Attribution and Marketing Mix Modeling are now included in Google Measurement Partners.


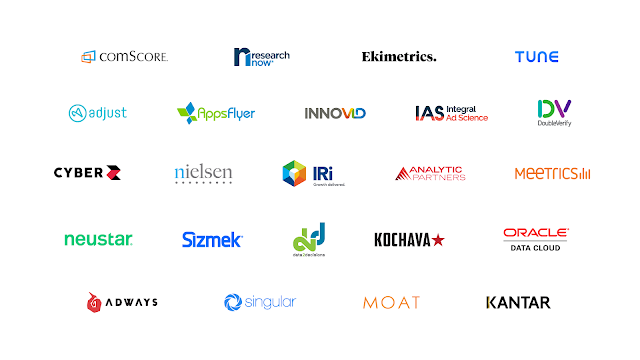
Our launch partners are recognized leaders within their focus areas and provide solutions widely used by the industry. They meet rigorous standards for accuracy and use reliable methodologies to measure KPIs that matter for marketers. And we work closely with them to ensure the solutions respect user privacy.

With trust and transparency at its foundation, Measurement Partners continues our commitment to providing both quality and choice when it comes to measuring performance and helping marketers better understand their customers. Alongside our partners, we’ll keep working to establish commonly accepted standards and advanced measurement solutions that help raise the bar for the industry.

Better understand and reach your customers with new Cross Device capabilities in Google Analytics


Today, we’re introducing new Cross Device features to Google Analytics. Analytics will now help you understand the journey your customers are taking across their devices as they interact with your website, giving you a complete view of the impact of your marketing so you can run smarter campaigns that deliver more tailored experiences to your customers.

Piecing together a more complete picture

Cross Device reporting in Analytics takes into account people who visit your website multiple times from different devices. Now, instead of seeing metrics in Analytics that show two separate sessions (e.g., one on desktop and the other on mobile), you’ll be able to see when users visited your website from two different devices. By understanding these device interactions as part of a broader customer experience, you can make more informed product and marketing decisions.

Say you’re a marketer for a travel company. With the new Acquisition Device report, you may find that a lot of your customers first come to your website on mobile to do their initial research before booking a trip later on desktop. Based on that insight, you might choose to prioritize mobile ad campaigns to reach people as they start to plan their trip.

In addition to the Acquisition Device report, you’ll soon have access to other Cross Device reports like Device Overlap, Device Paths and Channels. Our Cross Device reports only display aggregated and anonymized data from people who have opted in to personalized advertising (as always users can opt out at any time).

Reaching the right customers along the way

Analytics will also now help you create smarter audiences based on the actions people take on various devices. That way you can deliver more relevant and useful experiences.

Let’s say you’re a shoe retailer and you want to share a special promotion with your most loyal customers. You decide this means people who have purchased more than $500 in shoes on your website in the last 12 months using any of their devices. If a group of customers buy $300 worth of shoes on their phone and another $300 on their desktop, they’re just as valuable as another group who spend $600 on a single device, right?

Analytics now understands that these two groups of customers actually spent the same amount on your website, helping you create a more accurate audience list to reach the right customers. And spend isn’t the only way to segment and build audiences. You can also create remarketing campaigns to reach audiences based on how many times they visit your website across multiple devices.

Get started

To use these new Cross Device features, start by visiting the Admin section of your Analytics account and choose the setting to activate Google signals. (If you don’t see this setting, you will soon—we’ll roll it out to all Analytics accounts over the coming weeks.) There’s no need to update your website code or get additional assistance from a developer.

With these new beta features in Analytics, we hope you’ll quickly see that by better understanding the customer journey across devices, you can create more relevant and useful experiences for your customers.

Introducing Advanced Analysis in Google Analytics 360

In our conversations with marketers, we consistently hear that they are looking to gain deeper insights into the customer journey and then turn those insights into better customer experiences. 

Today we’re excited to announce Advanced Analysis, a new tool in beta for Google Analytics 360 customers. Advanced Analysis offers more detailed analysis techniques and deeper exploration capabilities, so you can improve your understanding of how people interact with your site and use those insights to deliver better experiences and reach your business goals.

Our top priority is to help you discover business insights while respecting user privacy. So, as with all Analytics capabilities, data utilized in Advanced Analysis is treated confidentially and securely.

Three ways to support sophisticated analysis


Advanced Analysis offers three new powerful techniques to help surface actionable insights about how people use your site: Exploration, Funnel Analysis, and Segment Overlap. And you can build audiences using any of the techniques, making it seamless to take action on the learnings that come out of your analysis.

With the Exploration technique, deeper analysis can be done in just a few clicks. Easily drag and drop multiple variables (segments, dimensions, and metrics) into the analysis canvas and see instant visualizations of your data. Exploration allows you to view and compare multiple analysis tabs in a single view — helping you test and refine your insights as you go.

Create multiple tabs and compare your analyses.
Use the Funnel Analysis technique to understand the steps users take to complete actions on your site. For example, you can quickly see how users progress through your purchase process and identify steps where it can be improved. With the current Custom Funnels in Analytics 360, you can add up to 5 steps (e.g. Visited Site, Added Product to Cart, Started Checkout, Started Payment, Purchased), but Advanced Analysis lets you add up to 10 steps. These extra steps - along with the ability to add multiple segments and dimension breakdowns - give you a deeper look at how different groups of people interact with your site.

The Segment Overlap technique allows you to see how segments you’ve created in Analytics 360 intersect with one another. For example, suppose you ran a major display campaign last month that led to a lot of new first-time purchasers, and now you want to know if they’re sticking around to become repeat customers. Segment Overlap allows you to compare how much this group of first-time buyers overlaps with users who have made a purchase in the past month and with users who are now returning to your site.

See overlap between different audience segments.

Advanced Analysis in action


Let’s review an example of how you can use these techniques together to uncover helpful new insights and put them into action. Imagine you manage an ecommerce store that sells to people around the world. You want to know if there are opportunities to improve your site experience for international customers and drive more sales.

With Advanced Analysis, you can get those answers easily. Starting with Exploration, you organize your Analytics 360 data to show number of users and revenue by country. You realize that you have a lot of new users in India but no revenue -- so there may be an opportunity to improve the checkout process and boost conversions.


Organize data by country to determine your top countries by traffic.

From there, you investigate further with the Funnels technique to compare conversion rates at each step of your purchase funnel for US and India users. In doing so, you see there is a steep drop in completion rate on the checkout step for the India group. This confirms what you suspected, that the checkout flow can be improved for these users.

With just two clicks, you build an audience of India users who have added a product to their cart but didn’t purchase. Once the audience is created, you can use Optimize 360 to test a new checkout experience for that group. And then, with just a few more clicks in Analytics 360, you can push that audience to AdWords or DoubleClick Bid Manager to run a remarketing campaign, taking advantage of the now optimized checkout flow.


Identify conversion rate drop off, and build a custom audience based on that segment.

For enterprises looking to better understand customer journeys, Advanced Analysis helps surface hard-to-find insights and makes it easy to put those insights into action. Advanced Analysis will be rolling out over the coming weeks as a beta to all Analytics 360 users.

Happy analyzing!

Posted by Dan Stone, Product Manager, Google Analytics 360


New Analytics Academy course: Getting Started With Google Analytics 360

Today, we are introducing a new course in Analytics Academy: Getting Started With Google Analytics 360.


Krista Seiden and Ashish Vij Introduce Getting Started With Google Analytics 360 (Video)


In this course, you will join instructors Ashish Vij and Krista Seiden as you learn key Google Analytics 360 features such as Roll-Up Reporting, Custom Funnels, Unsampled Reports, and Custom Tables. You'll gain insight into how you can benefit from reporting with BigQuery and native integrations with DoubleClick products, and we will provide you with real-world examples to illustrate how you can leverage Analytics 360’s features and integrations to drive performance and achieve your business goals.

By participating in the course, you’ll learn how to:
  • Set up Roll-Up Reporting
  • Analyze customer journeys with Custom Funnels
  • Leverage Unsampled Reports and Custom Tables
  • Analyze big data with BigQuery Export
  • Evaluate marketing performance with DoubleClick reporting integrations
Sign up for Getting Started With Google Analytics 360 now and start learning today.

Happy analyzing!

Helen Huang & The Google Analytics Education Team

Richer Google Analytics User Management

Today we are introducing more powerful ways to manage access to your Analytics accounts: user groups inside Google Analytics, and enforceable user policies. These new features increase your ability to tightly manage who has access to your data, and amplify the impact of the user management features we launched last year.

User Groups

User groups can now be created from and used within Google Analytics, simplifying user management across teams of people. This is a big time saver if you find yourself repeatedly giving out similar permissions to many people, and simplifies granting permissions as individuals rotate into or out of a team.

To start with user groups, visit either Suite Home or Google Analytics, navigate to the user management section, and click the “+” button. You will then see an option to add new groups, which will walk you through creating a user group, adding people to it, and assigning permissions to the group. Here is a full list of steps to make a user group.

Google Analytics User Management page highlighting the new option to create a user group

Enforced User Policies


Google Analytics 360 Suite user policies let you define which users will have access to your Analytics accounts, and which do not. When a user violates a policy, you will be warned of this through the user management section in Google Analytics or Suite Home and have the option to remove that user from your organization.

We have enhanced these policies so you can choose to block policy-violating users from being added to your Analytics accounts. While policies aren’t enforced by default, you have the option to block violator additions.  When you create or edit your organization’s user policy, you will see a toggle switch like the one below:

User policy setup showcasing the new enforced policy option
User groups and enforced user policies are supported in Google Analytics today, and support for more products is coming, as we continue to plan features that help customers better manage access to their critical business data.

Posted by Matt Matyas, Product Manager Google Analytics 360 Suite

Lessons from leaders: A data-driven approach helps deliver engaging, relevant messages


As marketers, we know how important it is to understand our customers and reach them at just the right moment. We also know that consumers have more control of their digital environments than ever — and that they expect us to consistently make recommendations in line with their interests, personalities, and behaviors.1 So how can we regularly communicate in a relevant way with all of our customers?

According to our new report on MIT Sloan Management Review, success starts with a strategy that’s backed by data. In the report, The Data-Driven Transformation, we speak with marketing leaders from Bayer, Tapestry Inc. (the parent brand for Coach, kate spade new york, and Stuart Weitzman), and Sprint. They open up with first-hand insights about transforming their teams to be more efficient, accurate, and agile. Here’s a few key insights from the research — and some words of wisdom from these top analytics pros.

Move toward a unified technology stack — and educate as you go

A recent study by the Association of National Advertisers showed that top marketing performers are the same companies that spend the most money on marketing technology.2 In many ways, their investments are paying off, but for those still using separate solutions for separate channels, there’s greater potential. Unifying their tech under a single, shared system could bring fuller, more tailored consumer insights — not to mention an easier way to evaluate what’s working and what’s not.

Jeff Rasp, director of digital strategy for Bayer’s Consumer Health division, did just that, helping reimagine his team’s approach to data. He oversaw the creation of a new marketing insights platform to consolidate data under a single customer ID, and also helped build the company’s first attribution model to evaluate their success.

Assemble teams with the analytics skills to uncover actionable insights

To deliver the right messages at the right times, marketing organizations need data scientists, mobile developers, and other data professionals. For Rob Roy, chief digital officer at Sprint, that meant building a new in-house analytics team to take operations over from external partners.

“We needed to get the right people who know how to build the architecture to house all the data,” Roy explains.

Once he found them, Sprint worked to integrate data across channels — from web and social media to retail and display — allowing the team more advanced customer segmentation capabilities.

Encourage collaboration across teams

A recent McKinsey study showed that 51% of top-performing marketers were part of a networked organization — one where cross-functional teams come together as needed. Parinaz Vahabzadeh, VP of global data labs at Tapestry, is one leader who’s made sure her team collaborates as a single unit.

“Our mandate is to democratize the data,” explains Vahabzadeh. “As a small, centralized team, we need to find ways to focus on the most impactful projects and also enable the broader teams to run analytics independently.”

Find out more

Want the full stories behind how these three brands are reimagining what they can do with data to reach their customers in relevant ways? Download the full report to learn more.

1-2 MIT SMR Custom Studio/Google, “The Data Driven Transformation,” January 2018

How to Turn Your Team’s Data Curiosity into Results


As a data expert, you know that most great ideas don’t strike like a bolt of lightning. They start with something slower: simple curiosity. They grow from “what if” to the seeds of an idea and, if you’re lucky, into some big next steps.

Many people on your team might also have these “what if” ideas too. For example, maybe they’ve got an insight about how to optimize your marketing plans and drive better results. But they might need a little nudge to turn those ideas into something bigger. For your organization to consistently get from insight to action, it’s important to give people at all levels the skills and training they need to explore their hunches using data. After all, you never know where your company’s next great idea might come from.

Here are three ways you can spread your data expertise to others, helping people beyond just a small team of go-to analytics experts.

1. Make training a priority

By analyzing the data that drives your business, anyone on your team can uncover how, when, and where consumers interact with your brand. That helps spread a deeper understanding of the customer journey throughout your organization. But to get there, you’ll need support to make data and analytics a priority — from the top down. In a recent study conducted by Google and Econsultancy, nearly two-thirds of leading organizations said that their executives treat data-driven insights as more valuable than gut instinct.1

One way to have an impact? Help executives create a training plan by determining what your team needs to know in order to analyze the data they’ve collected. By identifying the gaps between what they already know and what they still need to learn, you’ll have the insights you need to provide your team with the right level of training. Once you run a training session, record it and keep it online for later use, and share it with anyone who couldn’t make the meeting.

2. Share your success

If you’re a go-to data expert on your team, sharing your success is one of the most powerful tools you have to spread data literacy. Look for time to recap the results of a recent A/B test and show your team members how you achieved results. That will get them excited about what they can do with data. Also, don’t be shy — at every opportunity, recognize and reward others you see using data effectively. This helps build enthusiasm. Finally, use your knowledge and demonstrate proven business results to communicate what data can do.

As an analyst, you may even want to start thinking of your role in a new light. Analysts don’t just pull reports — they weave data narratives and interpret how data influences business results. That brings data to life and shows its value to the whole team. By sharing openly, you’ll give colleagues the tools they need to answer burning questions or dig deeper into their own hypotheses.

Looking for more ways to turn everyone one your team into a data-savvy marketer? We put together an infographic with 5 key steps to help get you there.

3. Work together across teams

While it might be tempting to use your data powers to make your own team shine, data is actually better when it’s used across teams. In fact, marketing leaders are 1.6X as likely as their mainstream counterparts to strongly agree that open access to data leads to higher business performance.2

You can take it one step further. Use your expertise to create and share easy-to-understand data reports outside your team. It’s a great way to help beginners make sense of recommendations and insights, and to get an idea for productive ways to use them.

When sharing your data, make sure it’s organized and easy for all teams to access and understand. Include clear definitions and common metrics so that everyone is on the same page. To go above and beyond, tailor insights specifically for different teams. That way they can get a deeper understanding of the report’s value. And don’t forget to consider the ways in which you deliver the data — every team has its own preferred channels for communicating.

Finally, don’t stop reaching out once you’ve worked to break down data silos in your company. It takes continued, active steps to keep data flowing across an organization.

With training in data analytics, every member of your team can support big ideas with real data. That helps ensure those ideas are taken seriously. And, in turn, it encourages your team to continue bringing new, diverse points of view to the table.

For more tips on sharing data expertise across your company, check out our Data-Driven Marketer's Strategic Playbook.

1-2 Econsultancy/Google, "The Customer Experience is Written in Data", May 2017, U.S. (n=677 marketing and measurement executives at companies with over $250M in revenues, primarily in North America; n=199 leading marketers who reported marketing significantly exceeded top business goal in 2016, n=478 mainstream marketers (remainder of the sample), May 2017

New: Streaming Google Analytics Data for BigQuery

Streaming data for BigQuery export is here.

Today we're happy to announce that data for the Google Analytics BigQuery export can be streamed as often as every 10 minutes into Google Cloud.

If you're a Google Analytics 360 client who wants to do current-day analysis, this means you can choose to send data to BigQuery up to six times per hour for almost real-time analysis and action. That’s a 48x improvement over the existing three-times-per-day exports.

What can I do with streaming data delivery?
Many businesses use faster access to their data to identify and engage with clients who show an intent to convert.

For example, it's well known that a good time to offer a discount to consumers is just after they've shown intent (like adding a product to their cart) but then abandoned the conversion funnel. An offer at that moment can bring back large numbers of consumers who then convert. In a case like this, it's critical to use the freshest data to identify those users in minutes and deploy the right campaign to bring them back.

More frequent updates also help clients recognize and fix issues more quickly, and react to cultural trends in time to join the conversation. BigQuery is an important part of the process: it helps you join other datasets from CRM systems, call centers, or offline sales that are not available in Google Analytics today to gain greater context into those clients, issues, or emerging trends.

When streaming data is combined with BigQuery's robust programmatic and statistical tools, predictive user models can capture a greater understanding of your audience ― and help you engage those users where and when they’re ready to convert. That means more sales opportunities and better returns on your investment.

What's changing?
Those who opt in to streaming Google Analytics data into BigQuery will see data delivered to their selected BigQuery project as fast as every 10 minutes.

Those who don't opt-in will continue to see data delivered just as it has been, arriving about every eight hours.

Why is opt-in required?
The new export uses Cloud Streaming Service, which costs a little extra: $0.05 per GB (that is, "a nickel a gig"). The opt-in is our way of making sure nobody gets surprised by the additional cost. If you don't take any action, your account will continue to run as it does now, and there will be no added cost.

What data is included?
Most data sent directly to Google Analytics is included. However, data pulled in from other sources like AdWords and DoubleClick, also referred to as “integration sources”, operate with additional requirements like fraud detection. That means that this data is purposefully delayed for your benefit and therefore exempt from this new streaming functionality.

For further details on what is supported or not supported, please read the help center article here.

How do I get started?
You can start receiving the more frequent data feeds by opting in. To do so, just visit the Google Analytics BigQuery linking page in the Property Admin section and choose the following option:

You can also visit our Help Center for full details on this change and opt-in instructions.

Ask a question, get an answer in Google Analytics

What if getting answers about your key business metrics was as easy as asking a question in plain English? What if you could simply say, "How many new users did we have from organic search on mobile last week?" ― and get an answer right away?

Today, Google Analytics is taking a step toward that future.  Know what data you need and want it quickly? Just ask Google Analytics and get your answer.
This feature, which uses the same natural language processing technology available across Google products like Android and Search, is rolling out now and will become available in English to all Google Analytics users over the next few weeks.
The ability to ask questions is part of Analytics Intelligence, a set of features in Google Analytics that use machine learning to help you better understand and act on your analytics data. Analytics Intelligence also includes existing machine learning capabilities like automated insights (now available on both web and the mobile app), smart lists, smart goals, and session quality.

How it Works
We've talked to web analysts who say they spend half their time answering basic analytics questions for other people in their organization. In fact, a recent report from Forrester found that 57% of marketers find it difficult to give their stakeholders in different functions access to their data and insights. Asking questions in Analytics Intelligence can help everyone get their answers directly in the product ― so team members get what they need faster, and analysts can spend their valuable time on deeper research and discovery.
Try it! This short video will give you a feel for how it works:
“Analytics Intelligence enables those users who aren’t too familiar with Google Analytics to access and make use of the data within their business’ account. Democratising data in this way can only be a good thing for everyone involved in Google Analytics!”
Joe Whitehead, Analytics Consultant, Merkle | Periscopix


Beyond answering your questions, Analytics Intelligence also surfaces new opportunities for you through automated insights, now available in the web interface as well as in the mobile app. These insights can show spikes or drops in metrics like revenue or session duration, tipping you off to issues that you may need to investigate further. Insights may also present opportunities to improve key metrics by following specific recommendations. For example, a chance to improve bounce rate by reducing a page's load time, or the potential to boost conversion rate by adding a new keyword to your AdWords campaign.

To ask questions and get automated insights from Analytics Intelligence in our web interface, click the Intelligence button to open a side panel. In the Google Analytics mobile app for Android and iOS, tap the Intelligence icon in the upper right-hand corner of most screens. Check out this article to learn more about the types of questions you can ask today.

Help us Learn
Our Intelligence system gets even smarter over time as it learns which questions and insights users are interested in. In that spirit, we need your help: After you ask questions or look at insights, please leave feedback at the bottom of the card.

Your answers will help us train Analytics Intelligence to be more useful.

Our goal is to help you get more insights to more people, faster. That way everyone can get to the good stuff: creating amazing experiences that make customers happier and help you grow your business.
Happy Analyzing!

MercadoLibre uses unique audience insights from Analytics 360 to raise ad RPMs by 60%

Washing machines and welding masks, comic books and baby strollers: just about everything is for sale on MercadoLibre. It's one of Latin America's biggest e-commerce sites, with 130 million registered users and an average of 4.6 purchases made every second of the day. What better place for an advertiser to reach a huge audience with sure-fire purchase intent?

To help their advertisers improve their programmatic direct campaigns, MercadoLibre used Google Analytics 360, part of the Google Analytics 360 Suite, to turn their first-party data into tailored audience segments.

"We want to help our advertisers do well," says Valeria Vinitski, Advertising Business Unit Director at MercadoLibre. "So we made use of our biggest media asset: our data. With over 150 million users, we have unique insights into the shopper journey. Integrating with DoubleClick for Publishers and Google Analytics 360 helped us create precise audience segments that are perfect for our clients' campaigns."

MercadoLibre started by creating audience segments for popular product lines like cell phones, cameras, and cars, and then made those Analytics 360 segments available to advertisers. Advertisers using DoubleClick Bid Manager could then negotiate the impression volumes they wanted at fixed CPMs for each of their priority segments.

With these Programmatic Guaranteed deals, advertisers are guaranteed reach and precision, as their ads are targeted to well-defined audiences that are more likely to buy their products. Ads can be tailored for each segment, boosting their effectiveness even more.

The results have been a win-win all around. The new campaigns have produced revenue per 1,000 sessions (RPMs) that are 60% higher than standard campaigns. Thanks to this new premium audience strategy, programmatic deals now account for 35% of MercadoLibre’s programmatic revenue.

MercadoLibre’s clients are also seeing great results. Magazine Luiza — one of the largest retailers in Brazil — found during a recent multi-publisher campaign that 23% of all its conversions could be attributed to MercadoLibre, and more than 25% of all revenue generated was from audiences exposed to the targeted Programmatic Guaranteed ads on MercadoLibre. The campaign drove a great deal of new customer acquisition for Magazine Luiza, with 40% of those new customers being first-time visitors.

"If we want to deliver better ad experiences, we need to use all our capabilities, data, and ad formats, no matter the sales channel," says Valeria. "Programmatic deals help us optimize our resources and save time while reaching marketing budgets from main brands that we otherwise wouldn't be able to gain."

Your site may not have 150 million users (yet), but whatever its size, Analytics 360 can help you boost revenues. Curious to learn more? See the full MercadoLibre story.