Even if you use managed instance groups in your Compute Engine environment, you know that scaling worker VM instances efficiently on a queue of jobs is not a trivial exercise. Sometimes the queue is empty and you want zero workers so that you’re not wasting money and resources. Other times the queue fills up quickly, is bursting at the seams, and you need all the workers you can get. Still other times, there’s a steady flow of work that you want to process at a consistent pace.
To help with these challenges, we're announcing per-group metrics scaling for managed instance groups, which lets you create a simple queue-based scaling system to address all of these scenarios. The feature relies on allowing managed instance groups to scale on previously unsupported Stackdriver monitoring metrics, such as the amount of work in a Pub/Sub queue.
This is a big improvement over the prior state of affairs. Before per-group metrics scaling, your best options were either to have a statically sized worker pool waiting around for work, or to write custom code to monitor the jobs in a queue, then manually scale worker pools up and down based on the current amount of work.
Using per-group metrics scaling
Let’s work through an example of how you can use per-group scaling in managed instance groups. Consider this simple setup. You receive data jobs that you want to process as they come in. Once started, a job can be processed in a couple of minutes, but the jobs arrive in unpredictable bursts. When a new data job appears, a Cloud Pub/Sub message is created and sent, and as these messages build up, the number of unprocessed messages in the Pub/Sub queue is exported as a Stackdriver monitoring metric. We’ll use this metric to drive the number of workers, which in turn pulls the Pub/Sub messages, processes the data and reduces the length of the Pub/Sub queue.

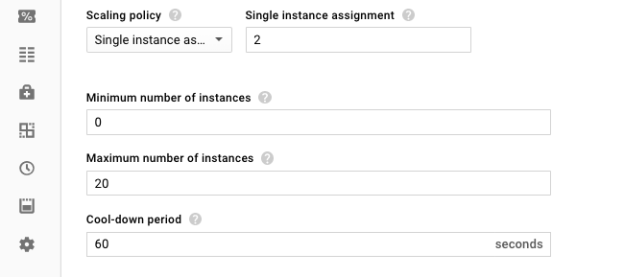
Set “Autoscale on” to “Stackdriver monitoring metric” and “Metric export scope” to “Single time series per group.” This is the setting that configures the managed instance group to scale on a metric that's independent of individual instances. Unlike typical autoscaling metrics such as average CPU utilization, the length of a queue is independent from the instances in the managed instance group.
Set the metric identifier to be the number of undelivered Pub/Sub messages, filtered by your specific subscription name. This allows the autoscaler to find the correct Pub/Sub queue to scale on.

gcloud beta compute instance-groups managed set-autoscaling \
    my-queue-based-scaling-group --zone us-central1-b --project my-project \
    --min-num-replicas 0 \
    --max-num-replicas 20 \
    --update-stackdriver-metric \
    pubsub.googleapis.com/subscription/num_undelivered_messages \
    --stackdriver-metric-single-instance-assignment 2 \
    --stackdriver-metric-filter \
    'resource.type = pubsub_subscription AND resource.label.subscription_id = "MY_SUBSCRIPTION"'
That’s it! Now, when messages arrive in the Pub/Sub queue, the managed instance group scales up, and as messages get processed, scales back down. When all the messages have been processed and the queue is empty, the managed instance group shuts down all machines in the group so that you don’t pay for resources that you aren’t using.
The diagram below shows how the number of instances in the managed instance group changes over 10 time-steps in response to the length of the Pub/Sub queue.

Queue unto others
It’s never been easier to set up automatic scaling for queued jobs using managed instance groups. With a single metric to measure the amount of work and a simple assignment of work per worker, you can set up a responsive scaling system in a couple of clicks.
Of course, this also works for queueing systems other than Pub/Sub queues. Anytime you can express the amount of work as a Stackdriver metric, and assign work per node, you can use per group metrics scaling for managed instance groups to optimize costs.
To get started, check out the documentation for more details.
