When you launch your Container Engine cluster, you can enable Cloud Monitoring with one click. Check it out!

If you head over to the Cloud Monitoring dashboard and click on the Infrastructure dropdown, you can see a new option for Container Engine.

If you have more than one cluster with monitoring enabled, you'll see a page listing the clusters in your project along with how many pods and instances are in them. However, if you only have one cluster, you'll be directed straight to details about it, as shown below.
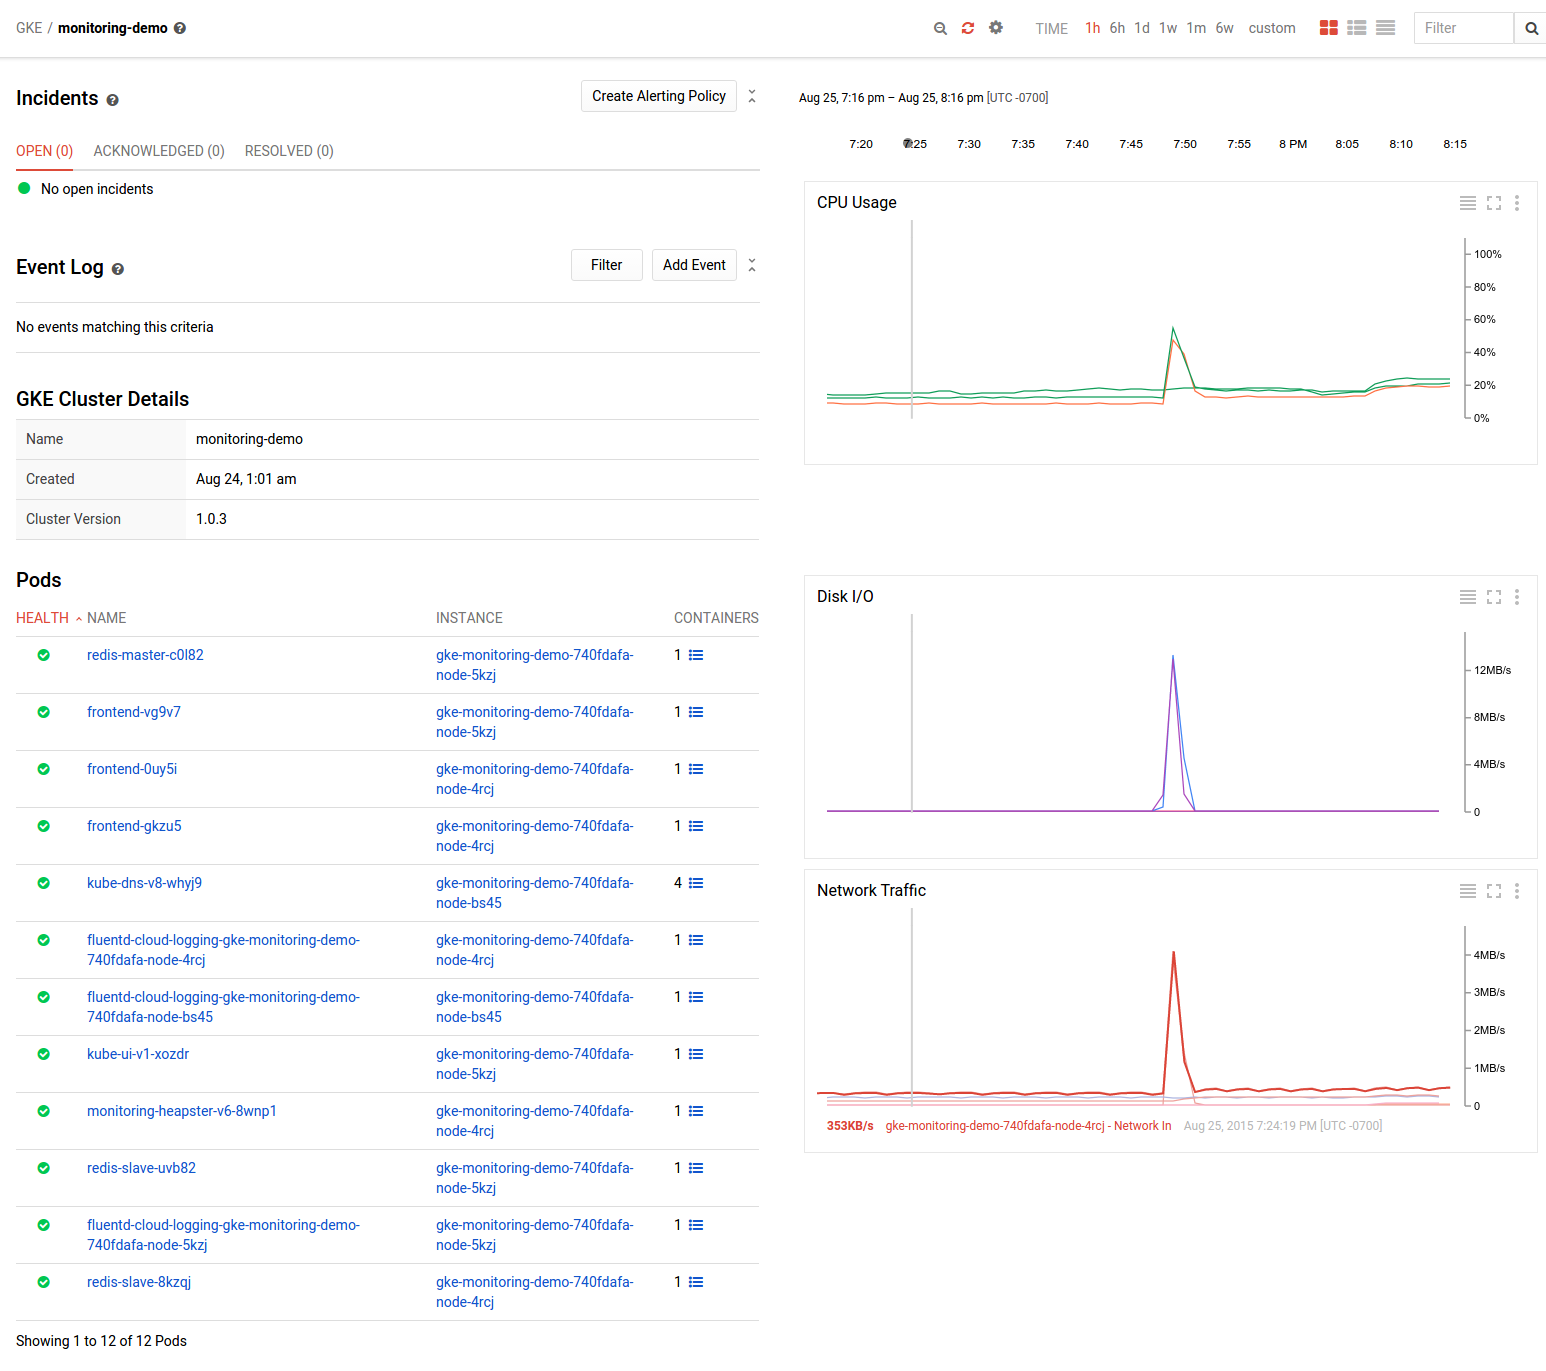
From here, you can easily drill down to the details of individual pods and containers, where you'll see metadata about the pod and its containers, such as how many times they've been restarted, along with metrics about the pod's resource usage.
But this is just the first piece. Since Cloud Monitoring makes heavy use of tags (the equivalent of Container Engine's labels), you can create groups based on how you've labeled your containers or pods. For example, if you're running a web app in a replication controller, you may have all of your frontend web containers labeled with “role=frontend.” In Cloud Monitoring, you can now create a group “Frontend” that matches all resources with the tag role and the value frontend.


With these tools, you can create powerful alerting policies that trigger when the aggregate across the group or any container within the group violates a threshold, for example, using too much memory. You can also tag your group as a cluster so that Cloud Monitoring's cluster insights detection will show outliers across the set of containers when they're detected, potentially helping you to pinpoint cases where your load isn't evenly distributed or nodes don't have even workloads.

And since this is all based on tags, it will update automatically, even as your containers move across the nodes of your cluster, even if you're auto-scaling and adding and removing nodes over time.
We have a lot more work planned to continue to integrate Container Engine and Cloud Monitoring and make it easy to collect your application and service metrics as well as system metrics that you can use today.
Do you have ideas of what we should do to make things better? Let us know by sending feedback through the Cloud Monitoring console or directly at [email protected]. You can find more information on the available metrics in our docs.
- Posted by Alex Robinson, Software Engineer, Google Container Engine and Jeremy Katz, Software Engineer, Google Cloud Monitoring
