The world is a beautiful, messy, constantly changing place—roads are added, buildings are built, and new businesses are opened all the time. Our role on the Google Maps team is to accurately model and reflect this ever-evolving world, and we’re often asked how we make a map that does that. The answer is, it takes a number of different steps, and the right mix of people, techniques and technology.
In a series of posts over the coming months, we’ll give you a closer look at how we build our map—diving deep into each of the elements we use to help more than one billion people navigate, explore and get things done. Today, we’ll start with an overview of the basics.
It all starts with imagery
Street View and satellite imagery have long been an important part of how we’re able to identify where places are in the world—it shows us where roadways, buildings, addresses and businesses are located in a region, in addition to other important details—such as the town’s speed limits or business names. In 2007, Street View launched to help people virtually explore the entire world, from the depths of Antarctica to the top of Mount Kilimanjaro. In the 12 years since then, our Street View car and trekker operations have collected more than 170 billion images from 87 countries. Thanks to our newest trekker that is equipped with higher-resolution sensors and increased aperture, we’ve significantly improved the quality of imagery we capture.
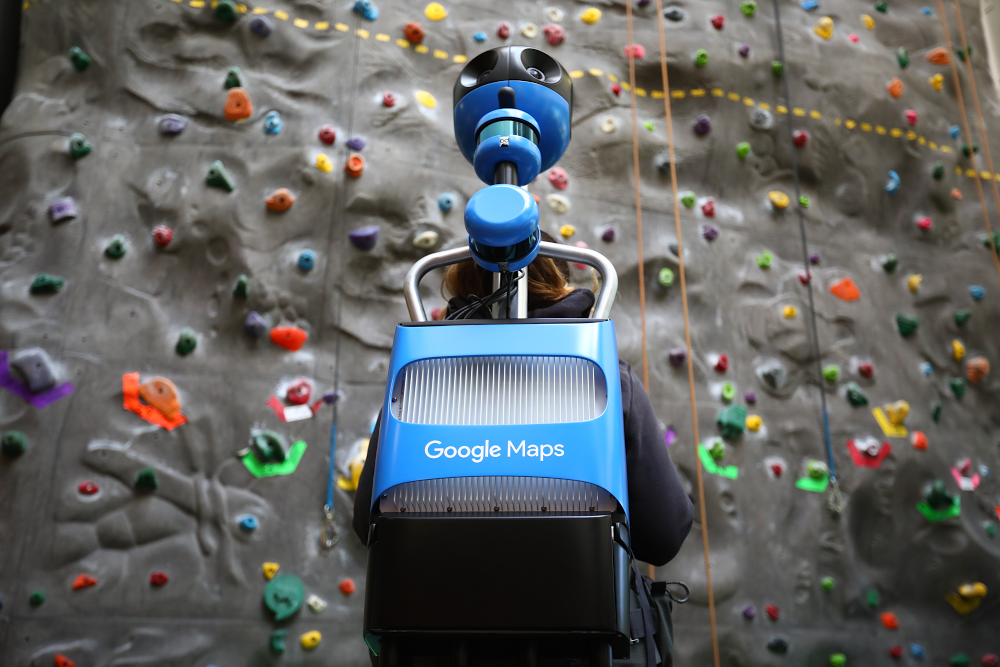
A Street View trekker
Then you add data
Authoritative data brings the map to life. Our data comes from more than 1,000 third-party sources from all over the world. Some, like the United States Geological Survey (USGS) and the National Institute of Statistics and Geography (INEGI) in Mexico, provide information about an entire country. Others are specific to smaller regions, like data from a local municipality, an NGO or a housing developer. Our teams carefully vet every authoritative data source to ensure that we have the most accurate and up-to-date data available. And recently, we introduced a new tool to make it easier for local governments to upload dataabout new roads and addresses in their area, right to Google Maps.
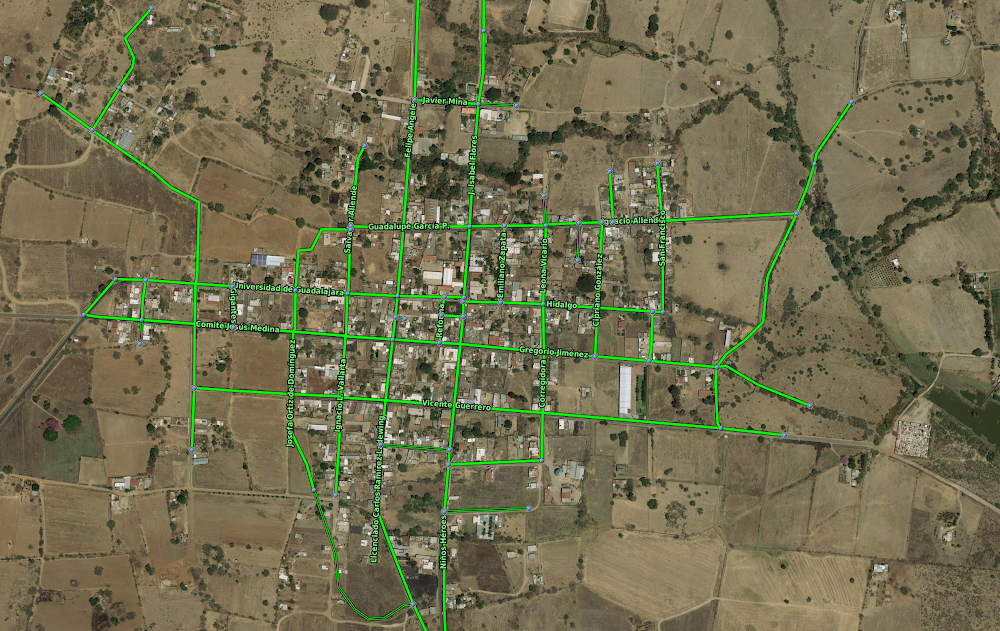
Road outlines from one of our data partners, the National Institute of Statistics and Geography.
A human touch
Data and imagery are key components of mapmaking, but they’re static and can’t always keep up with the pace of how quickly the world changes. This brings us to the third piece: the people that help us tie everything together. We have a data operations team staffed all over the world that plays a role in just about every aspect of mapmaking, from gathering Street View images and vetting authoritative data sources to correcting the map for inaccuracies and training machine learning models (more on that in a second).
We also have our community of Local Guides and Google Maps users, whom we empower to correct the map via the Send Feedback button in Google Maps. Our team reviews the information and publishes it if we have a high degree of confidence that it matches the roads, businesses and addresses in the real world.

Our data operations team at work
Speeding things up with machine learning
Imagery, authoritative data and human input have gotten us to where we are, but we want to make our maps more useful to more people even faster. To increase the speed of our mapping, we turn to machine learning. Machine learning allows our team to automate our mapping processes, while maintaining high levels of accuracy.
Let’s look at how we map building outlines as an example. Previously, an algorithm that tried to guess whether part of an image was a building or not resulted in what we dubbed “fuzzy buildings”—amorphous blobs that didn’t look like real buildings when you draw them on a map. And this was an issue—buildings are more than just buildings—they’re landmarks and a key part of how someone knows where they are when looking at a map. To fix this, we worked with our data operations team to trace common building outlines manually, and then used this information to teach our machine learning algorithms which images correspond with building edges and shapes. This technique proved effective, enabling us to map as many buildings in one year as we mapped in the previous 10.
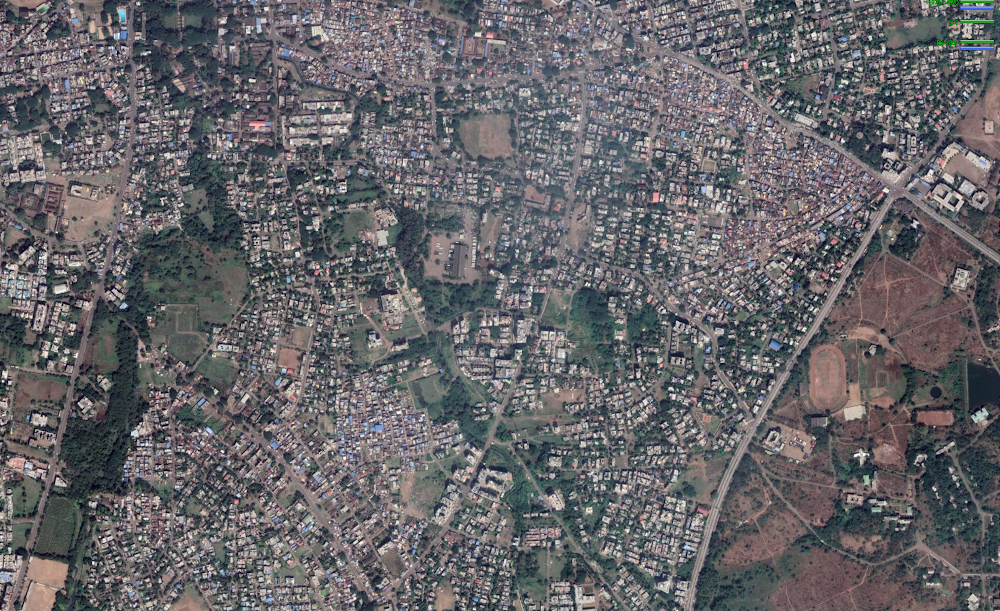
Fuzzy building outlines on Google Maps.
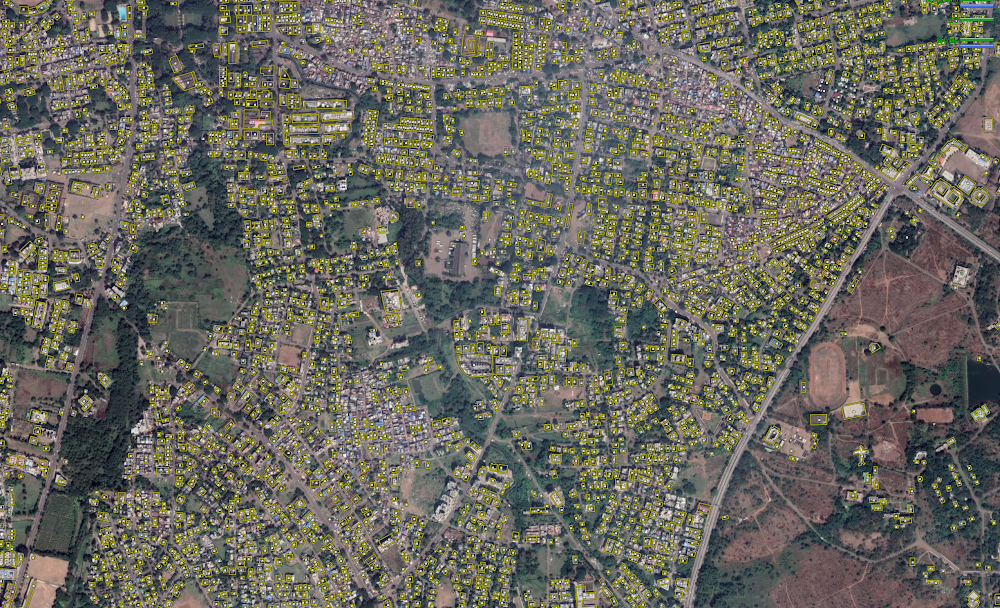
Clear building polygons outlined on the map.
We’re in it for the long haul
Maps are critical to helping communities thrive. They connect people with each other, help grow economies as people discover new businesses and restaurants, and help people get things done. Although we’ve come a long way, with maps in more than 220 countries and territories to date, we know that our work is far from over. Different regions have different needs, and their own mapping challenges. In our next post, we’ll take a closer look at how one component—imagery—helps us overcome these challenges.

