With the world of commerce at their fingertips, consumers are more curious, more demanding and more impatient than ever before. As a result, retailers have to anticipate customers’ needs in order to provide the products they’re looking for and plan marketing strategies. In a recent study, we learned that 84 percent of Americans are shopping in any given 48-hour period, in up to six different categories.1 Whether they’re looking up designer sneakers or DSLR cameras, Google is the first place they go to discover a new brand or product.2
Starting today, a new version of our Shopping Insights tool can help you uncover which products and brands are popular, trending up or down, and how these insights vary by regions in the U.S. This new version includes data for more than 55,000 products and 45,000 brands—significantly increasing coverage over the previous version—as well as nearly 5,000 categories. It’s a free tool, available to everyone, that can help you follow trends in your categories.
In addition to more data, we’ve also added several key features to help you inform your strategies.
Compare the popularity of a brand within searches for a category
Nearly nine out of 10 smartphone users are not absolutely certain of the brand they want to buy when they begin looking for information online.3 That’s a huge number of consumers looking to uncover new brands and products. With this new feature, retailers can track the relative popularity of various brands within a category and adjust their strategies accordingly.
For example, the most-searched backpack brands of last 12 months were JanSport, Fjällräven and The North Face, classic brands that have been around for at least 50 years. Searches for the category and all three brands peaked during back-to-school season in 2018, and saw slight growth during the holiday season.
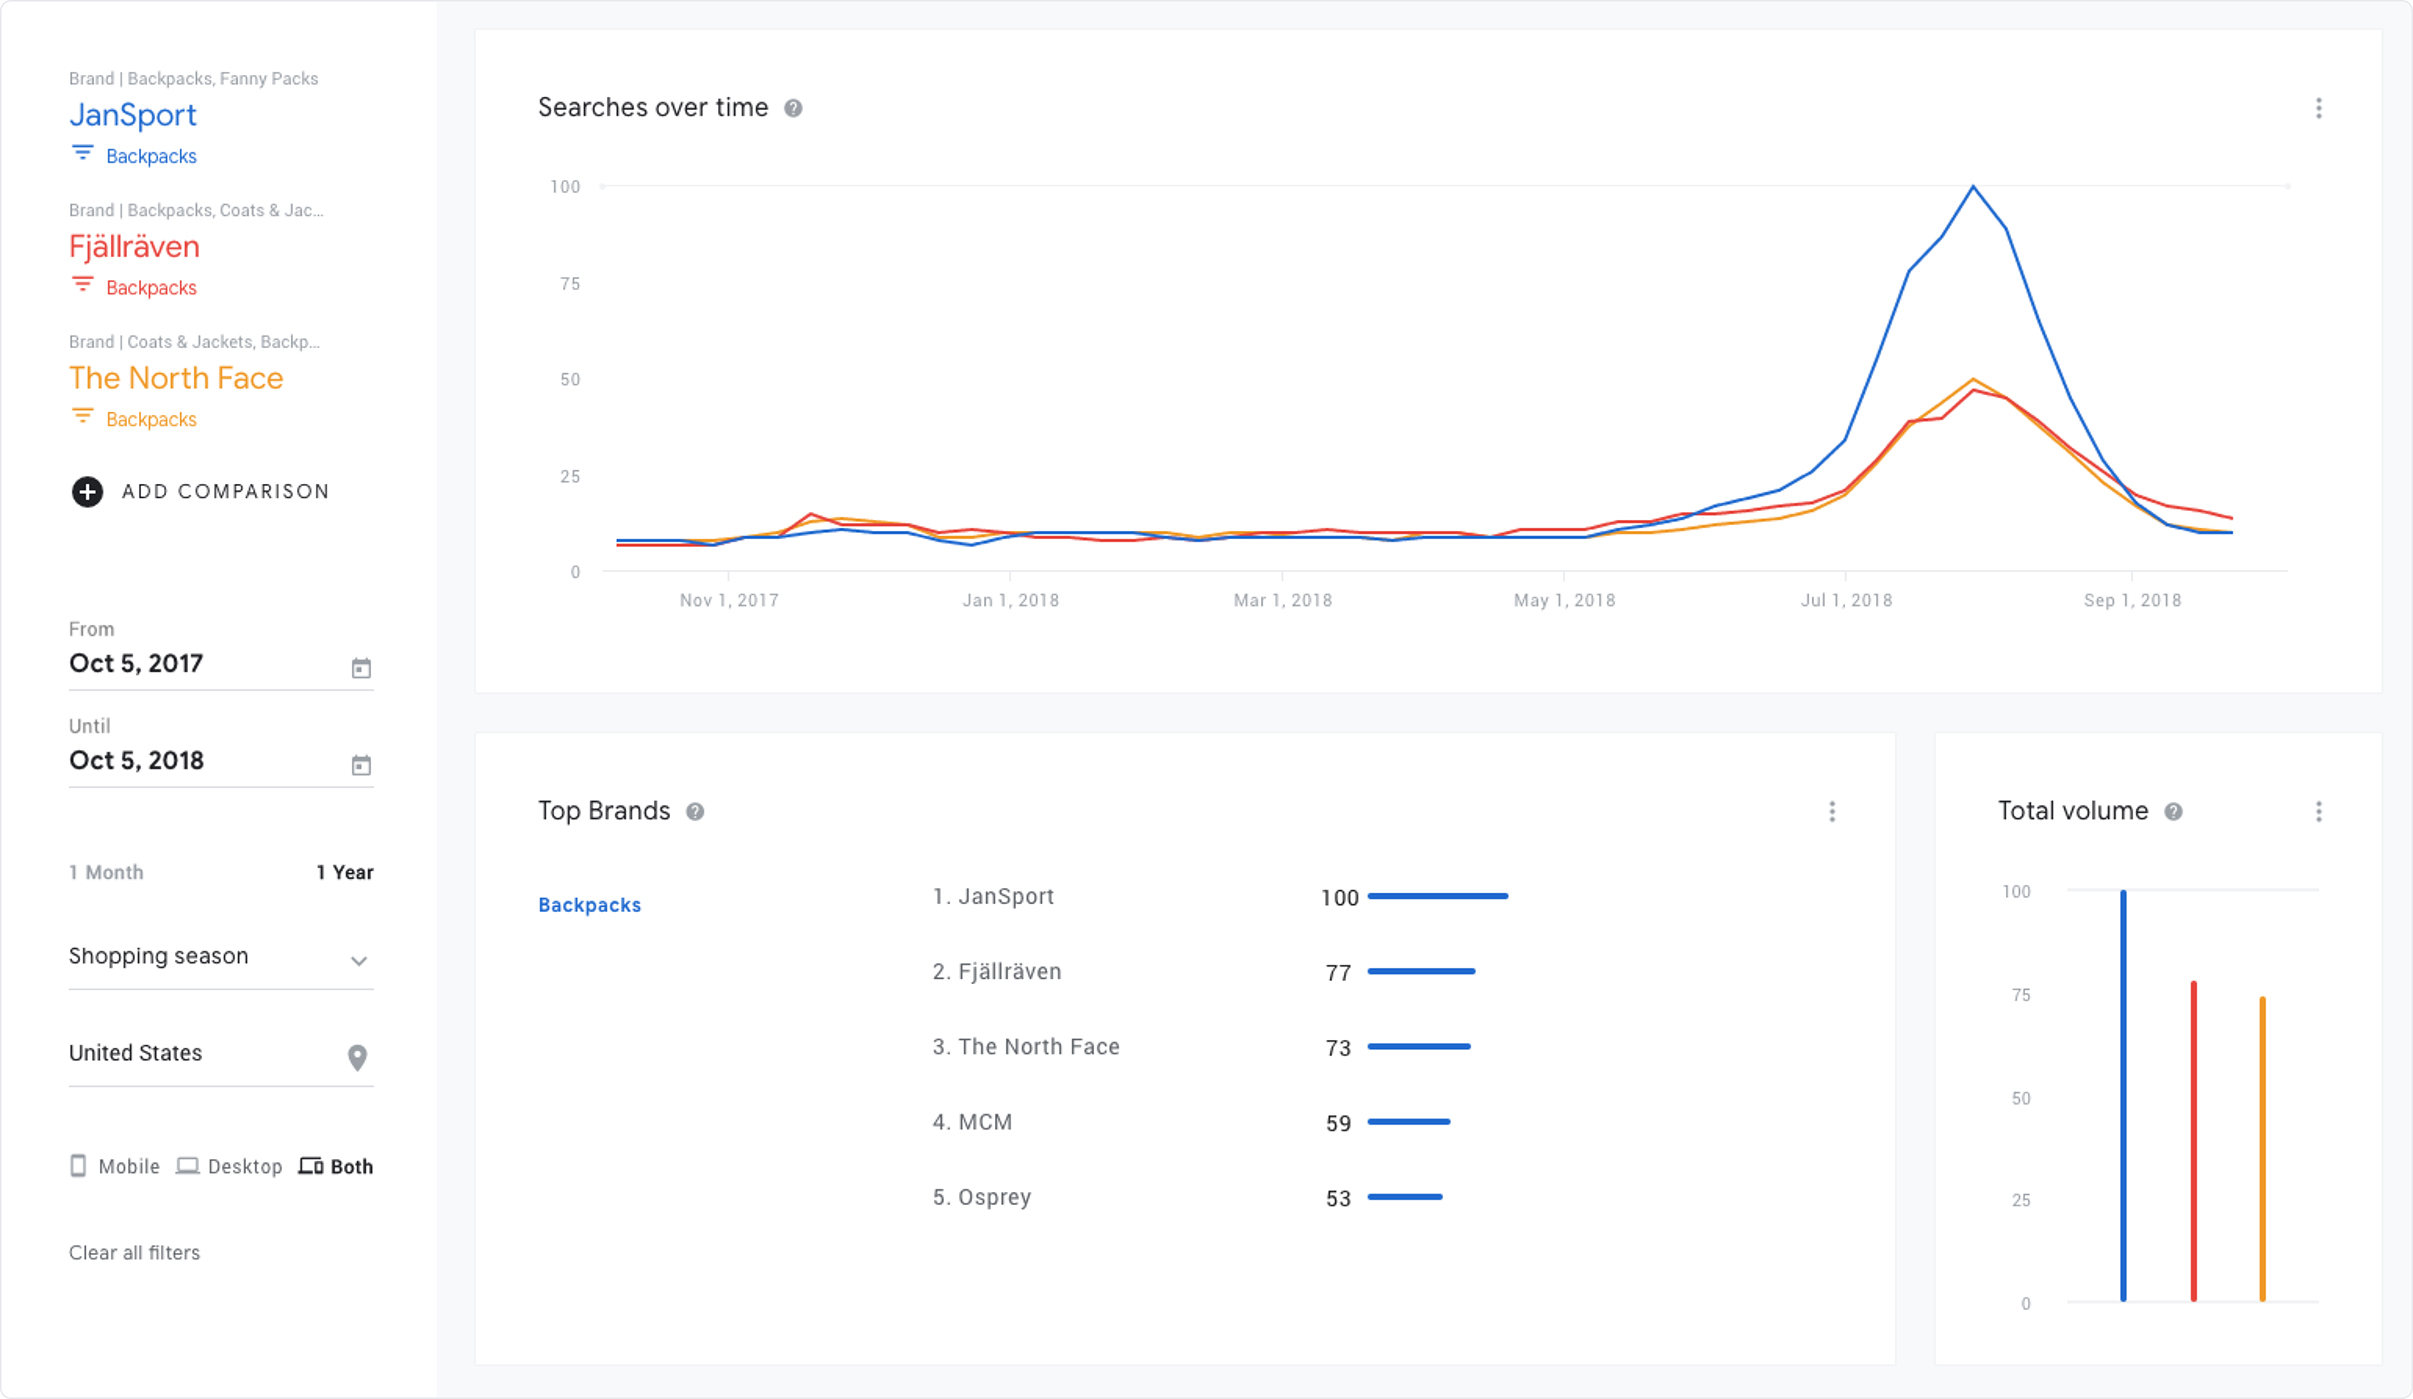
Example: Relative search volume for top backpack brands, Oct 2017 - Oct, 2018
But if you reset your time range in Shopping Insights to the holiday season in 2017 (see below), you’ll find that a very different brand was popular in search. MCM, a luxury brand that specializes in “street luxe”–a fashion trend popular among millennial shoppers–was the most-searched brand when consumers were shopping for backpacks. It continued to grow in December, even when searches for other brands were tailing off, peaking on December 25. In fact, MCM was also the only luxury brand in the top 10. By tracking this data weekly, marketers can optimize their tactics in season, and respond to changing consumer preferences within different categories.
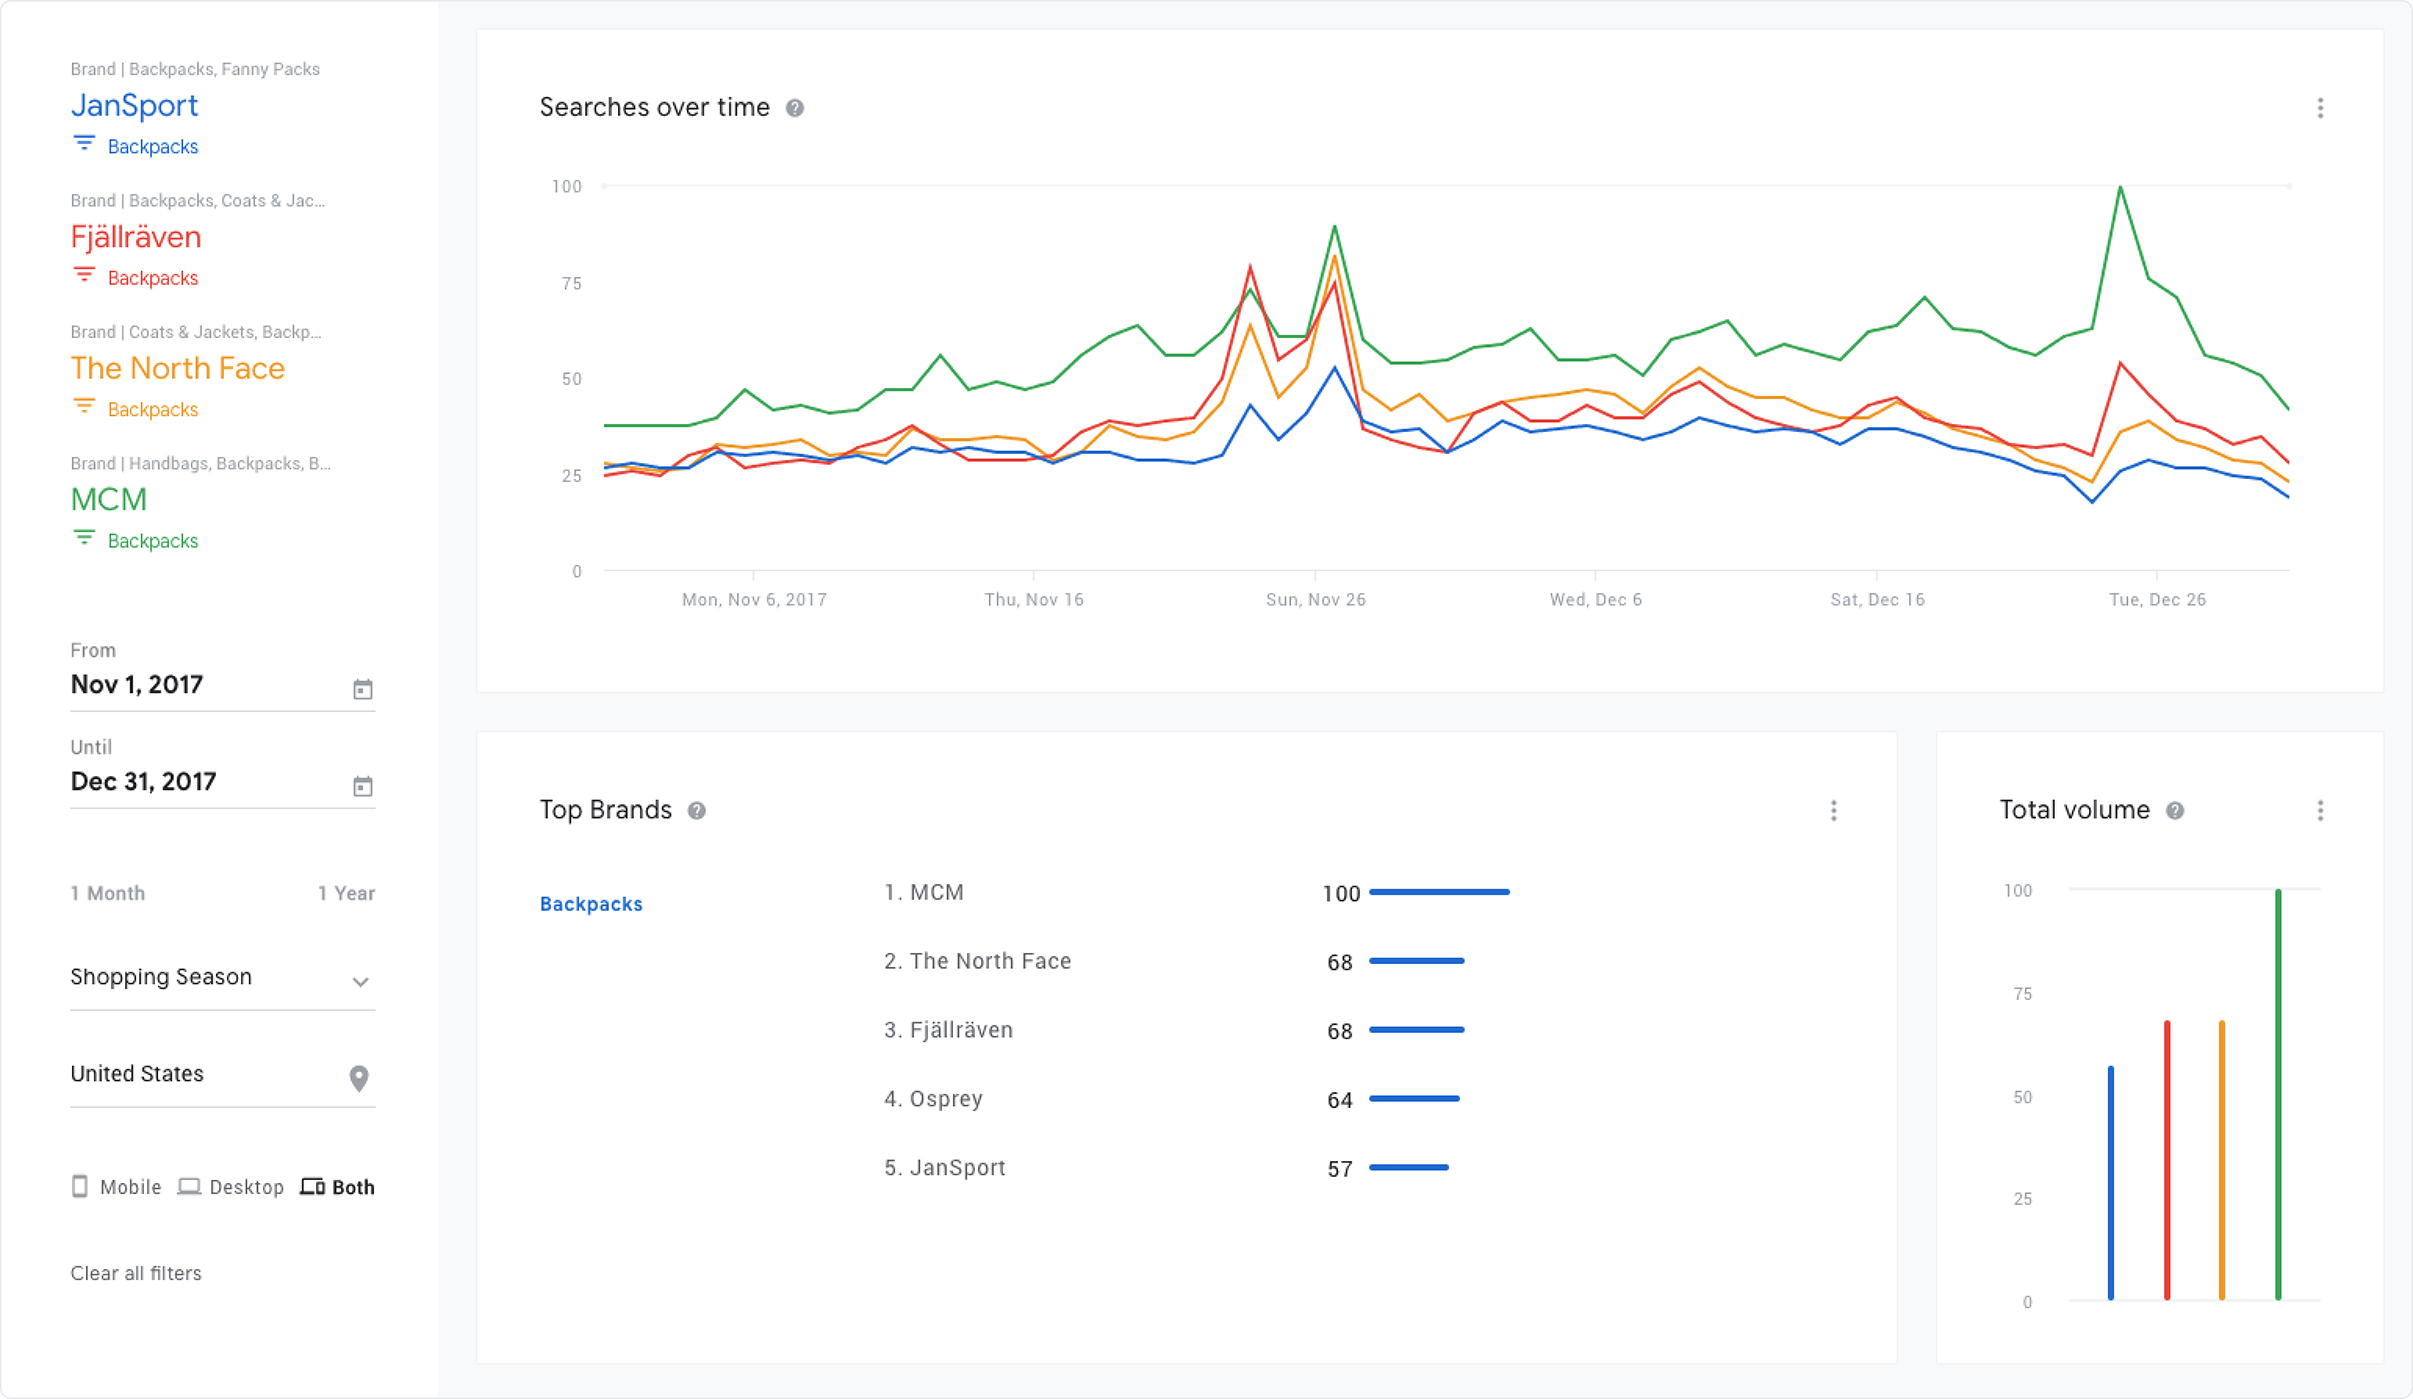
Example: Relative search volume for top backpack brands, Nov 1 - Dec 31, 2017
You can also use Shopping Insights to understand the relative importance of brands within different categories, and how consumers search for products. In the example above, while MCM was the most searched brand, the top three brands were only mentioned in ~8 percent of the queries. This means most users were searching using keywords that described the category and characteristics of the products they were looking for, rather than specific brands.
In contrast, for video game consoles, the top three brands were mentioned in ~90 percent of the queries. Whether shoppers are searching for specific products, using broader shopping queries or brands, knowing this information will help you adjust your marketing strategy. Showcase Shopping ads, for example, can help retailers tap into consumer demand in such categories.
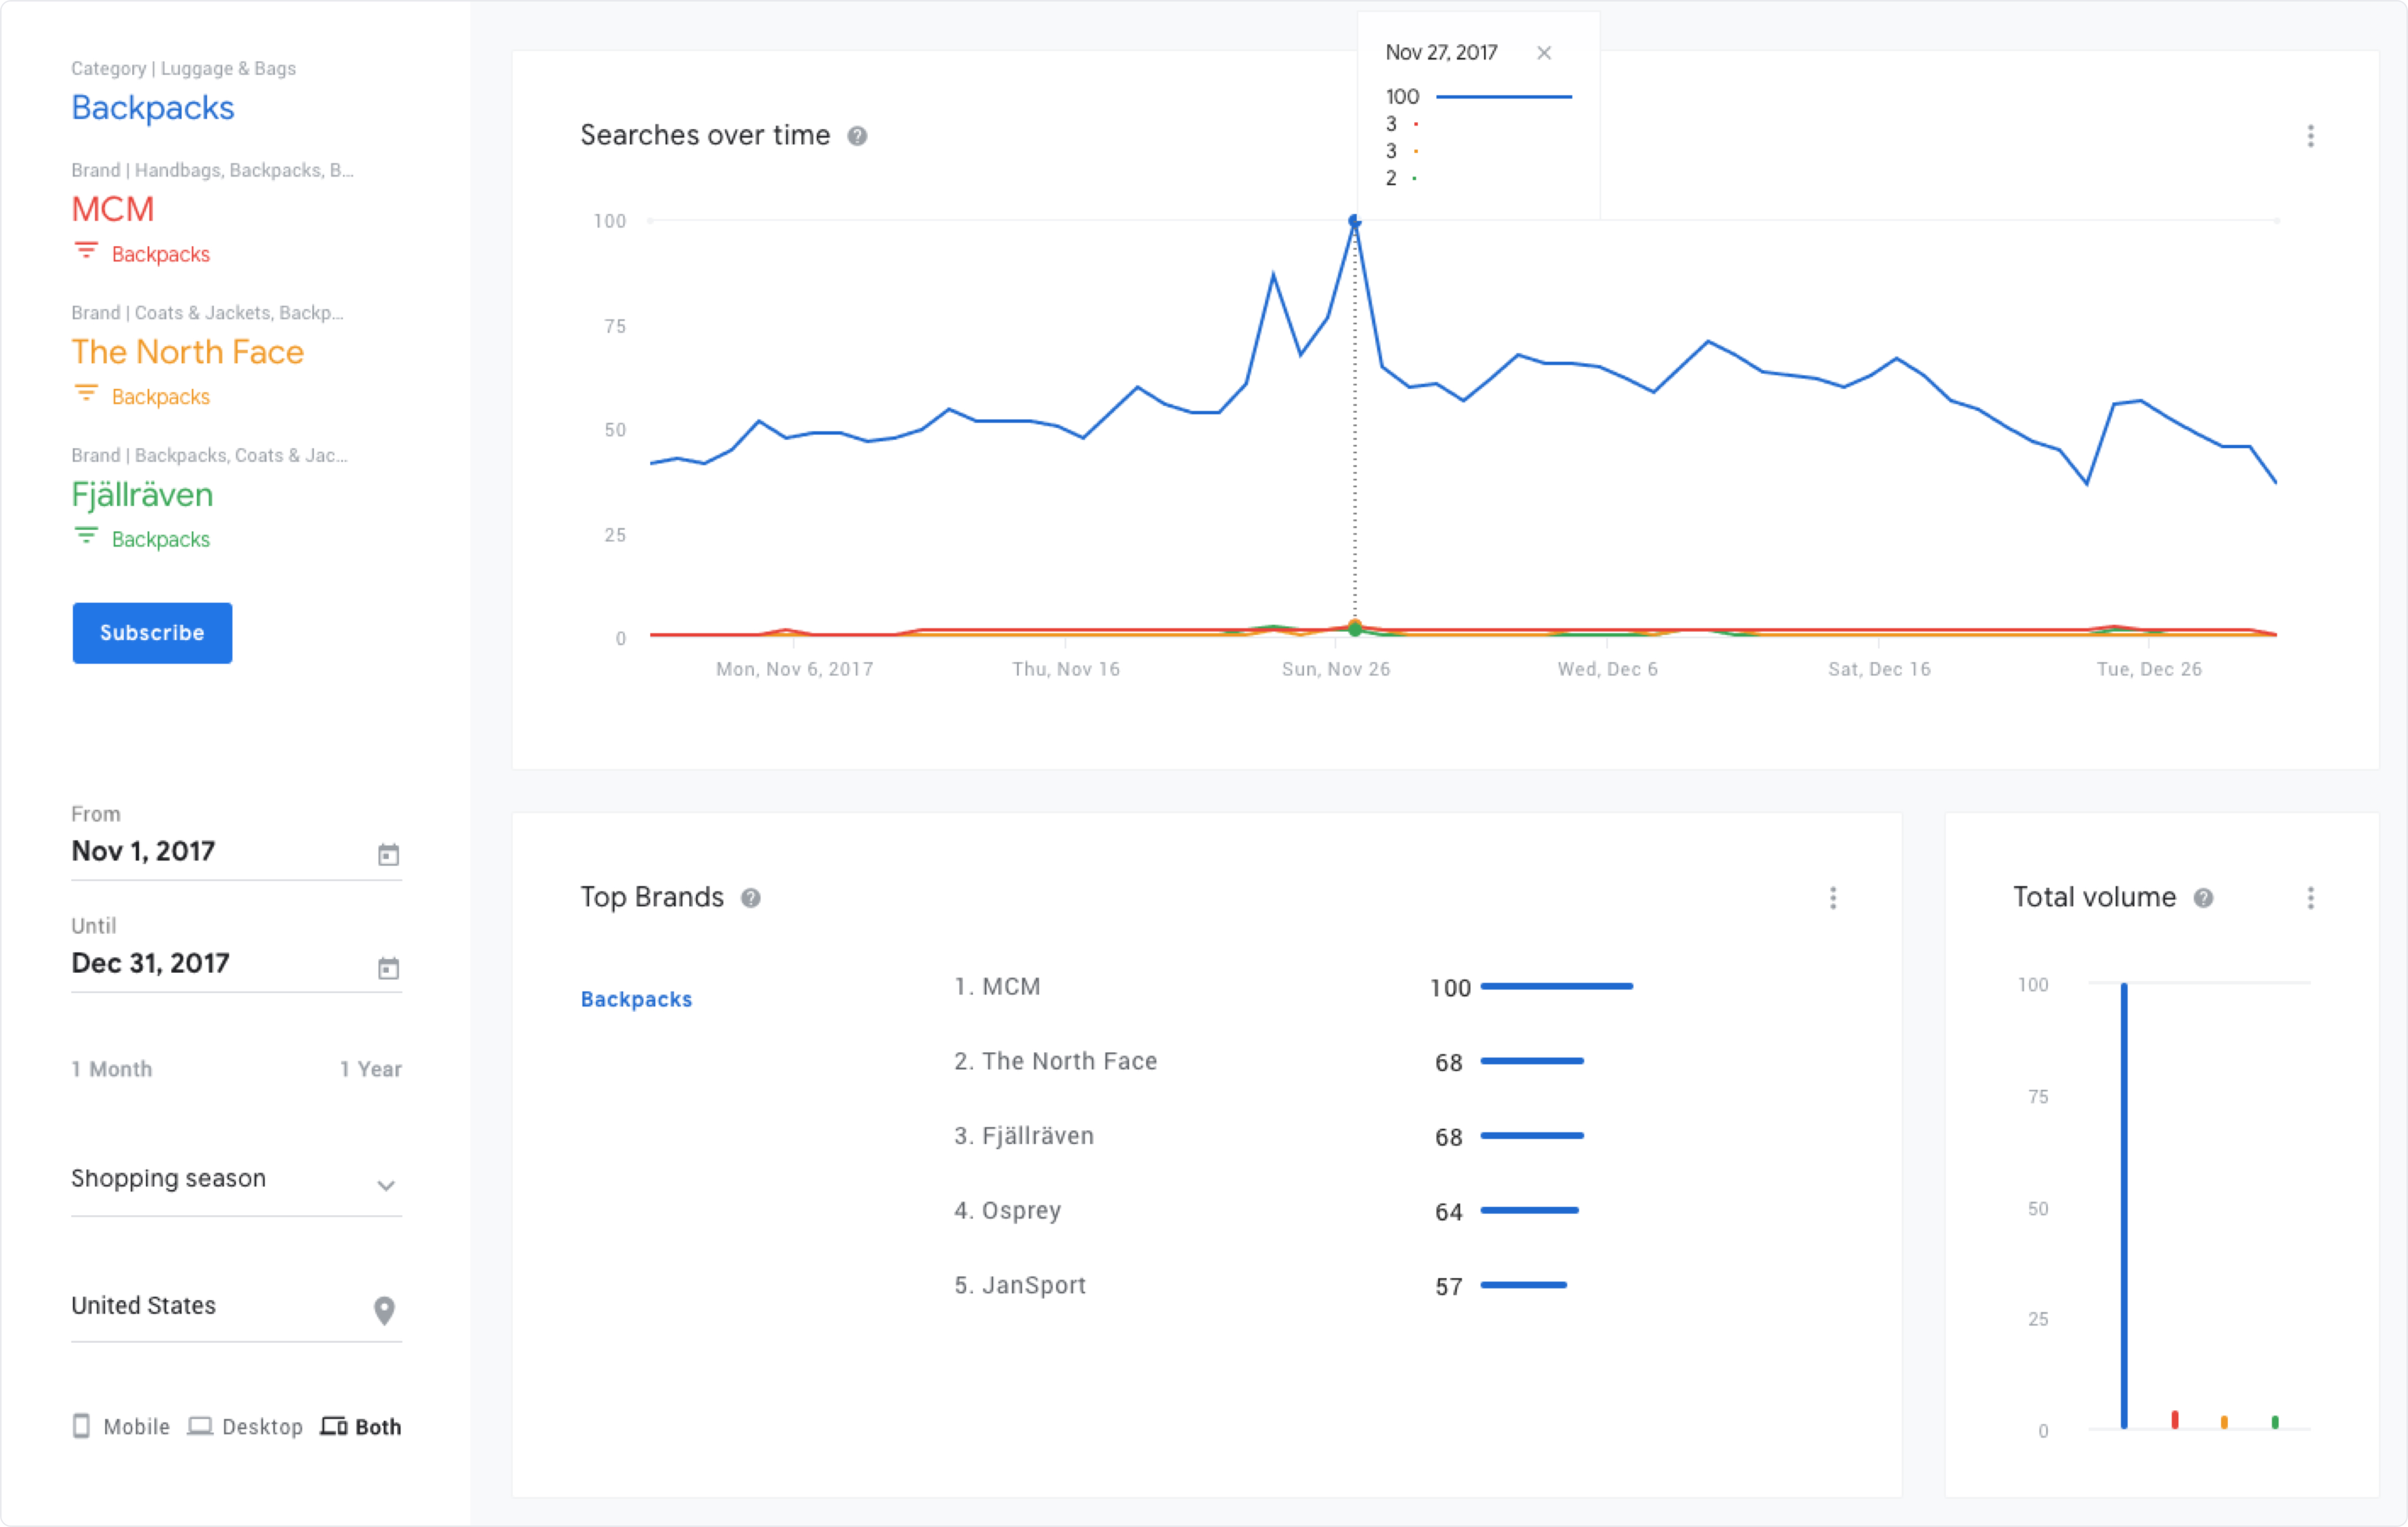
Example: Shopping searches and top brands in Backpacks category, Nov 1 - Dec 31, 2017
Subscribe to personalized reports with weekly and monthly trends
You can now create up to 10 weekly and monthly email reports for the products and categories you want to follow, so you don’t miss current or future trends. We’ll send you additional data on popular, growing and trending products and brands. For example, in our monthly category reports, we determine which products are trending up or down by removing noise and seasonality effects from the product’s search volume. In weekly reports, you can see which products grew the most in the previous week, as well as any outliers.
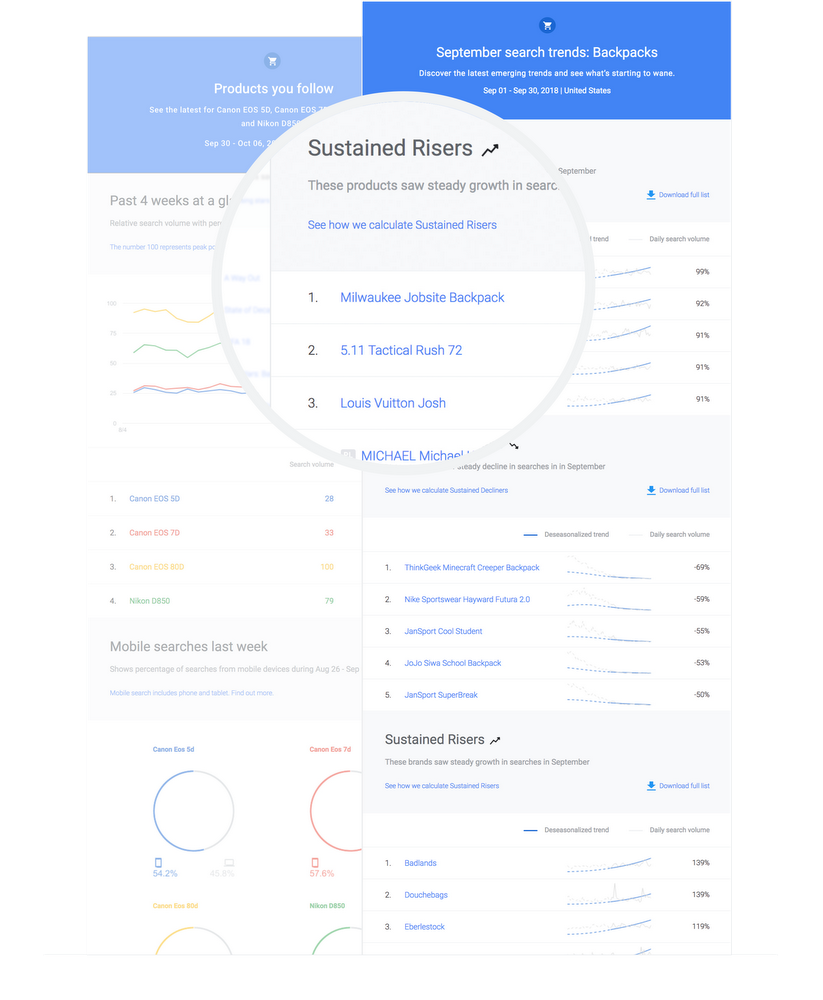
Example: Monthly report about trends in Backpacks, September, 2018
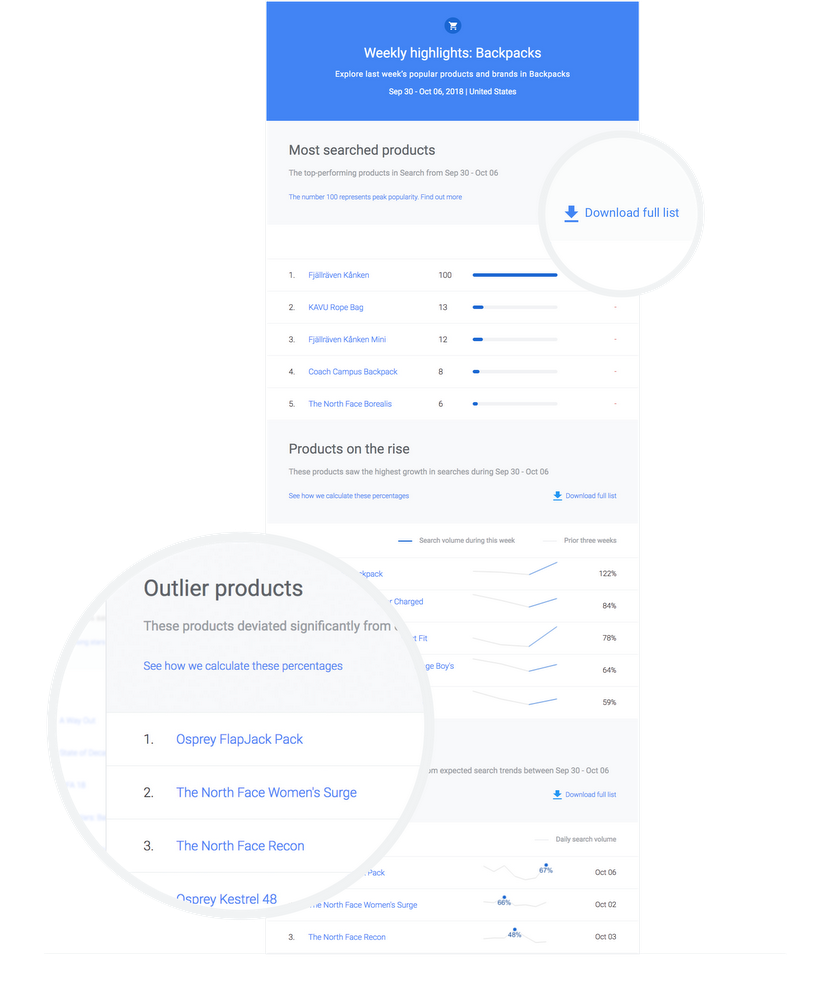
Example: Weekly highlights report for Backpacks, Sep 30 - Oct 06, 2018
Getting started with Shopping Insights
The Shopping Insights Tool is available on desktop and mobile in the U.S. Start exploring the data and subscribe for free reports on Shopping Insights today.
1. Google/Ipsos, “Shopping Tracker,” Oct - Dec 2017, Online survey, US, n=3,613 online Americans 13+ who shopped in the past two days.
2. Google/Ipsos, “Shopping Tracker”,April - June 2018, Online survey, US, n=2703 adults 18+ who shopped in the past two days
3. Google / Ipsos Connect, Jan. 2018, Playbook Omnibus 2018, n=1,604 US online smartphone users, A18+